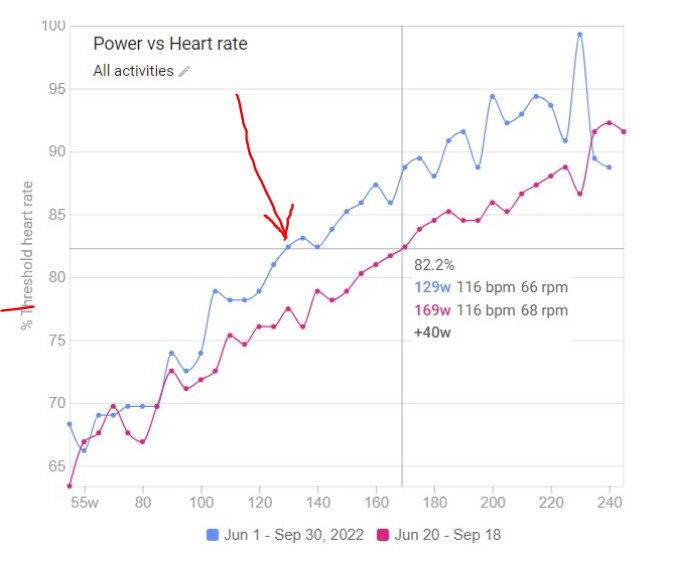
In the watts vs threshold HR plot, when you drag the mouse along the plotted data, the table of data that appears is not always correct. Here is an example:
The watts should be 169, and HR of 116 is 82% of threshold. But the blue data is not right, with both incorrect watts and HR!