maybe it’s just me but I find “difficult” to read the weekly charts on /compare page
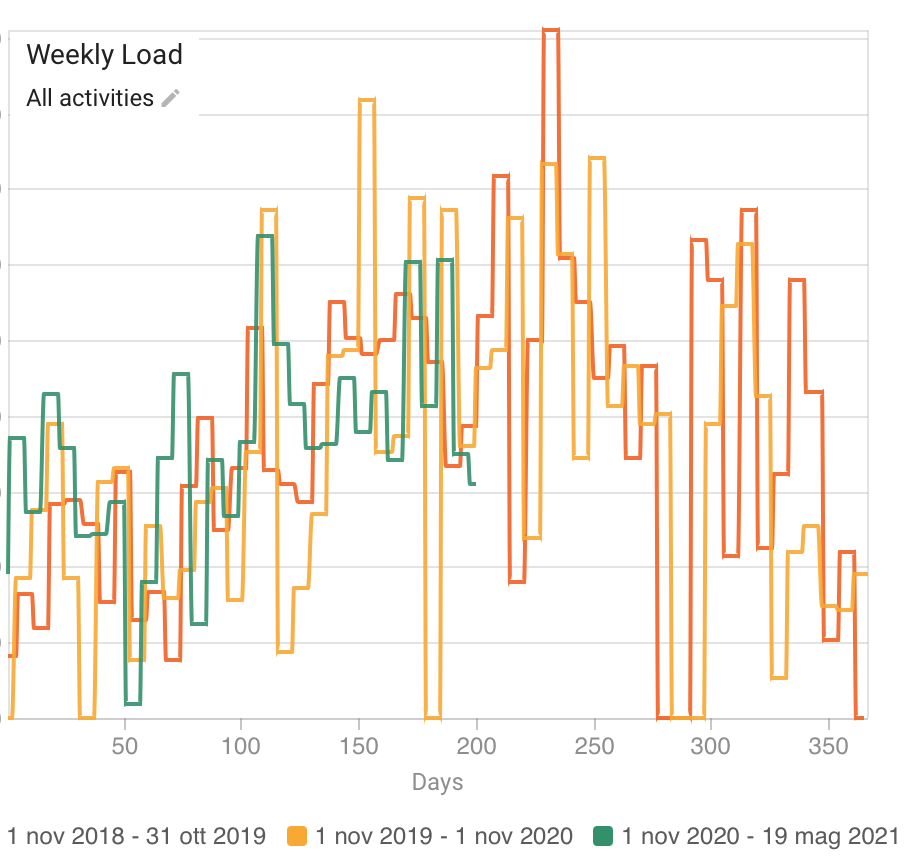
I mean, I know how to read it but it’s not very obvious, in this case I think a bar chart or something else would be better
maybe it’s just me but I find “difficult” to read the weekly charts on /compare page
I mean, I know how to read it but it’s not very obvious, in this case I think a bar chart or something else would be better
@Filippo I had to play with several of the charts to make them clearer. Try some different options, such as 7-day average instead of weekly total; or use dots instead of a continuous line.
What you want to try to do is to smooth out the display in some way or to remove the dominance of the vertical lines.
I second this request. Line charts imply continuous relationships, there should be an option to plot bar charts, and I suspect it would be simple enough to implement.
I agree. Will see what I can do later this week.