Coasting time as a % of moving time

Minimising coasting time is one of the key things I try to do on my rides. Especially when I am focusing on maximising my outdoor z2/ endurance rides.

It would be great if you could show the coasting time on a ride as a % of the moving time on the main activity page so I can quickly review. Currently I do this manually each time :slight_smile:

Mock up example below:

image

For those interested, I try to keep coasting time at 8% or below - this number was picked up from a WKO5 webinar Tim Cusick presented and his reasoning was as simple as “because its less than 10%” :slight_smile:

1 Like

I agree the metric would be nice to see; another data point that can be used without having to calculate manually.

However, it may be a good metric, but it can be fooled by soft pedaling, the race/activity and/or the terrain.

In my last 4 races, all with different terrains:

  • 23% of 2:52 (1100m elevation in 96km)
  • 16% of 2:19 (583m elevation in 97km)
  • 9% of 6:00 (2043m elevation in 177km)
  • 21% of 2:55 (756m elevation in 116km)
  • 5% of 0:30 (66m elevation in 18km) <— Crit race.

Most of the downhill time is spent freewheeling, and after each attack/rotation in the paceline, I would freewheel and then soft pedal before going again.

In training though, completely different story. I vary about 8-12% on outdoor rides.

1 Like

I think it is most valuable on solo endurance training rides to maximize their efficiency and reduce junk miles as much as possible… Once you get in a pack, you loose control on the freewheel-time.
In a race, you would want as much freewheel-time as possible by hiding in the pack until the deciding stage.

4 Likes

Yep I completely agree and it is why I use the metric when looking at my z2/ endurance rides mainly - where the focus is keeping pressure on the pedals, time in zone and I have more control over terrain to enable the type of work I want to be doing.

1 Like

As coasting is a natural thing even in races, I don’t see value in this metric. Riding in a bunch can have a higher % of coasting compared to a solo ride. Does it make that bunch ride less Z2? I don’t know - could be. It’s one of those metrics I ask myself, what do I know with this and more important, what will I do with it? If for some day you revise some arbitrary number, like 8% or 10% … what about the next workout? You gonna focus on keeping pressure on the pedals? It’s at most a metric for a bike computer but for after ride analysis, I don’t know …

1 Like

As with many metrics, they are better used in conjunction with other data and not in isolation.

When it comes to making the time spent on the bike the most productive it can be (when doing my z2/ endurance rides) then absolutely…Yes

1 Like

I have added coasting % on the summary and also as a column on the activity list view. It is something I try minimise on training rides myself.

4 Likes

Fantastic. Thank you very much @david :+1:t2::ok_hand:t2:

Seems like the coasting % is calculated from activity time. Shouldn’t it be calculated from moving time?

2 Likes

It is supposed to use moving time. I just checked one of my rides and it is correct. Can you point be at one that is wrong? Tx.

Bildschirmfoto vom 2022-06-04 17-06-07

Should be around 20%. Total activity time was 345 minutes, doesn’t match up with the 9.5% either.

Activity: Intervals.icu

Fixed. Tx for that. For the developers wondering how I got this one wrong:

return ct * 100 / (this.activity.moving_time | this.activity.elapsed_time)

Bitwise or | instead of boolean or || :slight_smile:

4 Likes

Thanks for fixing it so quickly, great feature, will be very useful to me.

@david Any chance we can also get this metric if you don’t have a powermeter, but do have a cadence sensor? Will be less precise as there can be some spinning without putting actual power on the pedals, but will be good enough to track trends on Z2 rides. Thanks!

Is it possible to graph the portion of moving time NOT spent coasting in hours/minutes on the custom graphs page? I would like to do this so I can more easily compare my winter indoor riding hours (no coasting) to summer outdoor riding hours (lots of coasting where I live). Thanks!

Ah i found another thread that showed me I could do this on the Fitness graphs so I built this but am wondering if there’s a way for me to show Moving minus Coasting or at least reorder the stacked bar so that the light purple is at the bottom

It’s relative simple to do that with a custom activity field. I created one for you but you need to add it to one of your activities. Click “Custom” under the activity timeline chart and click the search button:

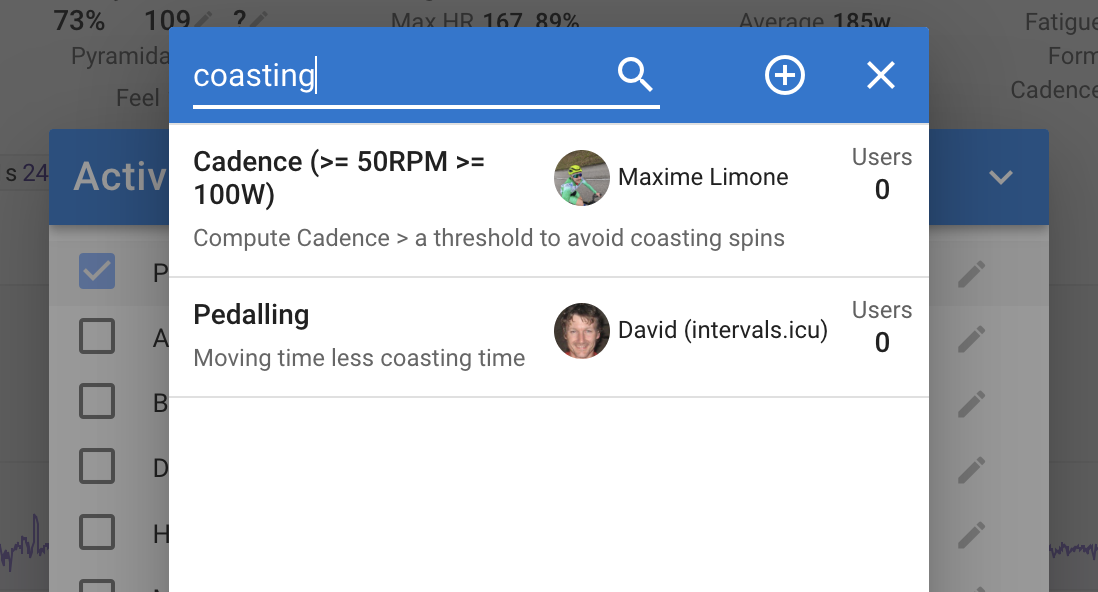
Just click it and you will get your own copy. The code is simple:

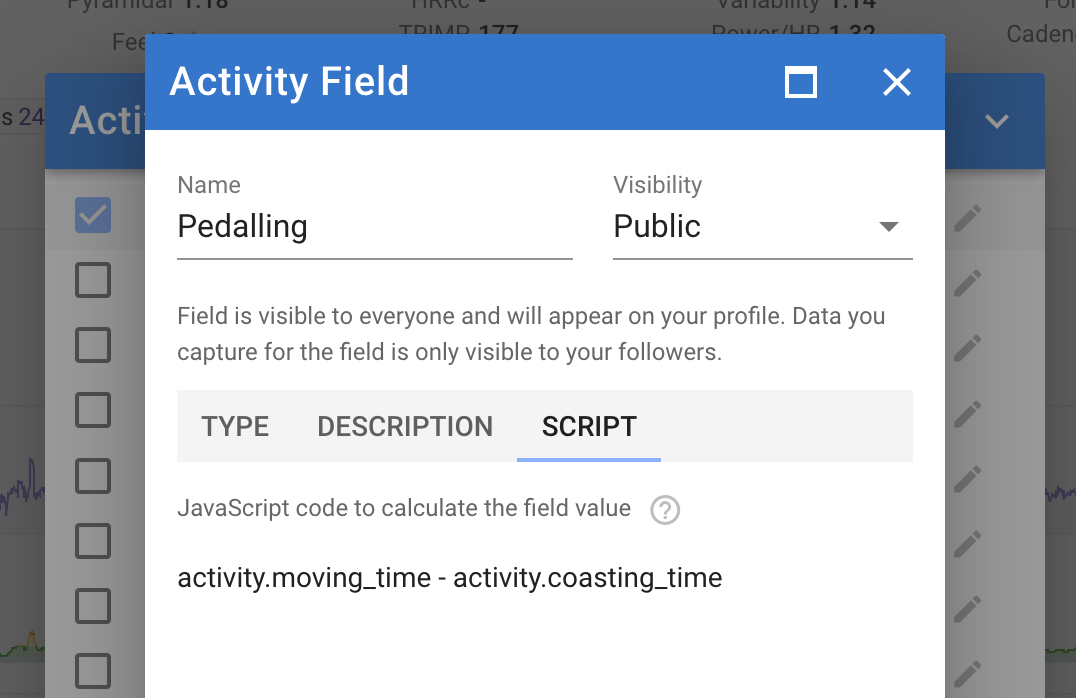
It will be calculated for the current activity. To compute it for other activities use the activity list view. Select the activities to update and click Edit → Analyse. Tick the “Keep existing intervals box”.

You can see I also added it to the grid.

Once you have done that you can plot “Pedalling” on the /fitness page.

There are a lot of ways to customise Intervals.icu for things like this:

You could create a custom activity field for that. You can actually overwrite the build in coasting_time field with your own value computed from cadence in the script.

Thanks so much! Exactly what I was looking to do.