I have a client who has lost confidence in the accuracy of intervals.icu. He believes he has been working really hard recently and yet his blue line have been consistently dropping and he is finding it almost impossible to get the fatigue line above it. I have tinkered with his zones recently and its possible that might have caused some problems. He is considering switching to TrainingPeaks as a result in this loss in confidence. I’ve checked his zones and they appear correct. I’m not sure if theres anything else I can do (such as resetting his whole data somehow)? Has anyone experienced something similar?
There’s nothing wrong with the system, but rather inputs that might not be optimal. Things to check are:
-
You don’t specify the type of activities, eg. cycling, running, etc., but the principle is the same… are threshold settings correct?
-
You mention tinkering with his zones; have you reanalysed the activities after changing the settings? This would include selecting the range of dates to apply the “reset.
-
Check fitness and fatigue settings, to see if the defaults (42/7) have changed. Add calendar entry, then click on fitness days to check if it’s default or something different.
-
The term “working hard” is a relative one, and can still drop if the weekly load is lower each week. Without seeing the data, or having access to view it, it’s difficult to know if it’s the system or the athlete.
1 Like
"He is considering switching to TrainingPeaks as a result "
TP is using same calcs so as far the input data is the same, the resulting graph will look the same too.
it is very simple:
fitness is moving avg load from 42 days
fatigue is moving avg load from 7 days
if he is doing less, the graph will drop
ps. those graphs overvalu z2 rides so if he moved in to a vo2max block for example and for last weeks was doing mostly hard intervals with much lower weekly volume, the graph will drop, but same will do the TP graph, again they are based on same math.
this graph is about working harder then before, even if you do just one hour a week, it will rise if you did nothing a week before. And it will drop even if you do 20 hours but you did 25 hours last week.
All those graphs were designed to help roughly to plan your training into the future and not show your current fitness. More like a volume of your training, nothing more. IF he really cares that much about those graphs, just schedule him a loooot of z2 work.
3 Likes
Is he using Power?
A general answer that may or may not help you (sorry for the tangent on this topic).
Subjective experience trumps any graph.
The basic problem with the Bannister style fitness, fatigue and form line chart is that the underlying model was developed more than 40 years ago, and it is very simple, probably too simple and linear to properly fit a complex thing like real world performance. For example, the only variable that the fitness-fatigue chart uses is training related exercise dosage. But we know that in the real world, form also depends on environmental, psychological and nutritional aspects. We need better models, but by the time we have finished developing the model, and tested it and tried it, the athlete has already moved on to the next day. It will be amusing to see the adoption rate of these models particularly among world class athletes, olympic teams etc.
Thanks guys, really appreciate the replies.
Gerald:
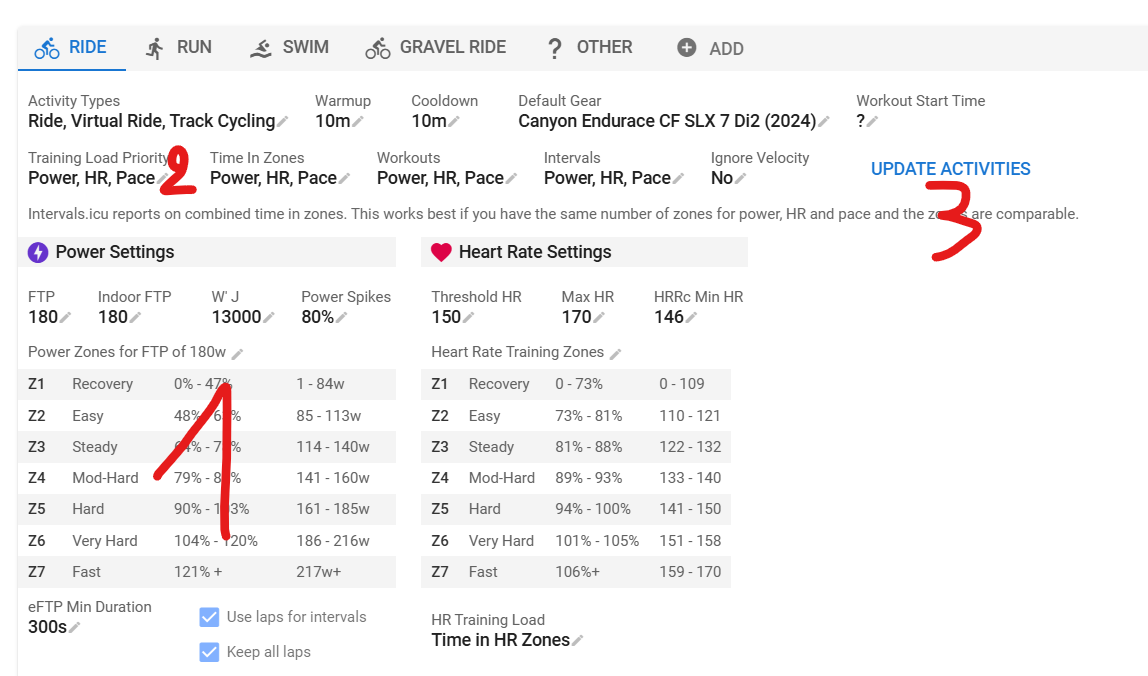
- He is a cyclist. Threshold settings are correct. Zones are now correct.
- Not sure what you mean by re-analysing the activities, sorry. The activities certainly look correct now (the thumbnail colours didn’t after I first adjusted the zones). I clicked on the ‘Update Activities’ near the zone settings in the hope this would somehow overwrite the old data after changing the zones. It didn’t appear to change anything.
- Not sure how to adjust the fitness and fatigue settings. Have looked in ‘Options’ in the fitness setting but there is no option to adjust these in my version.
- Appreciate the term ‘working hard’ is a relative one. He is convinced the data isn’t correct, I’m not but I did see each activity thumbnail change when I adjusted his zones and I think this was the trigger to think the data might not be correct. It got me questioning it too. A hard reset might put his mind at rest. I guess that’s what I was hoping for.
Lukasz:
- Thanks but I am aware what the fitness graphs represent and have explained this to the client.
- I have indeed scheduled him to up his volume!
MedTechMD:
- Yes he is.
Coach_Ron:
- 100% agree. I speak about many measurements of fitness (not just intervals.icu fitness line). It’s an almost impossible thing to calculate. I think part of the problem with clients interpreting a line like this is that it comes down as fast as it goes up, when in the real world, fitness isn’t lost that quickly.
I think he is likely not taking into account his load numbers are down recently but regardless, I wanted to check:
- Is it possible the fitness graphs could be altered by adjusting settings? If not, that gives me powerful ammunition to go back to the client.
- If there was a way of doing a ‘hard rest’ of all data, which again, might reassure the client.
- Partly I reached out here because I couldn’t find an option to contact the developer and ask them to look into it (I think David heads intervals.icu up)?
One simple solution that I came up with, which might be helpful for other clients in a similar situation is that I suggested to the client to sign up to Strava’s 30 day free trial and then compare the two graphs. If they have the same shape to them and look almost identical, the data in intervals.icu should be correct! My client hasn’t done this yet though.
First you are talking about the fitness page, now you are talking about wrong zones settings and therefore wrong mini charts in the calendar view. Could you show what the difference shall be?
Because the formulas are basically the same here and in TP for the fitness page. But obviously the result will only be the same, if it’s the same input.
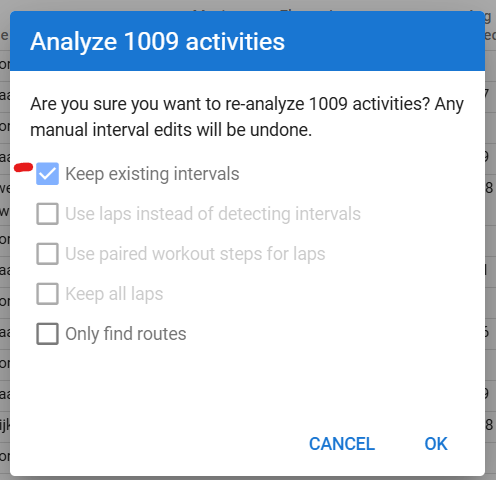
If you update the settings after uploading the activities, you have to reanalyze them. Every new activity will copy the current Thresholds and Zones from the setting page. If you change that afterwards, the activities will still have the old settings.
- If you change the zones, and want all (old) activities to have these zones, click “Update Activities” in the Settings page. But you only change the zones relatively to the threshold. The threshold will not be updated! (Only those percentages of threshold will be updated)
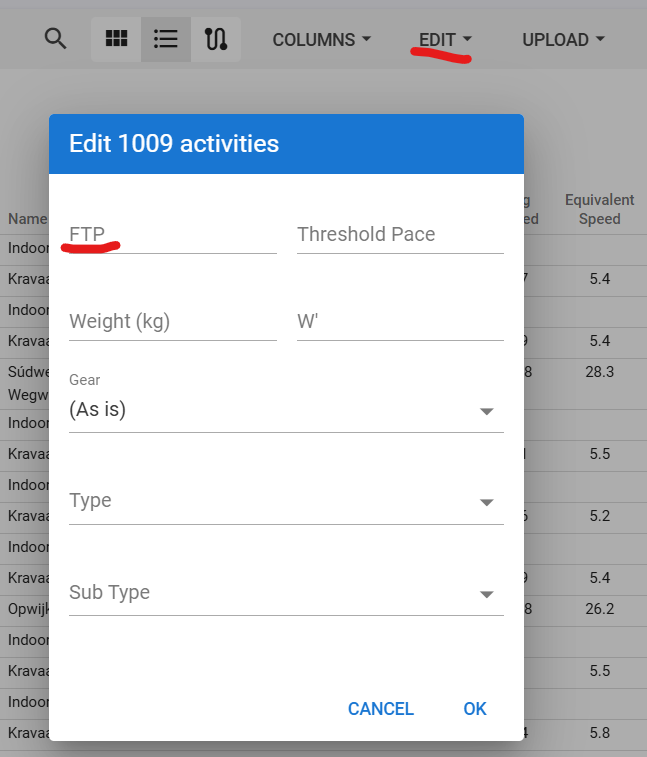
- If you want to update/correct the Threshold (FTP), you have to do this for example in the activity list. Select all activities to be updated, then select Edit → Edit and Type the correct FTP value.
1 Like
Basically what @R2Tom posted above but in a more detailed step by step instruction:
- First edit the zones in Intervals to reflect exactly the same % as in TP for each category (don’t mind the differences in absolute power values at this time). Set the priorities to something with Power first. Then click on the Update activities button to apply those zones to all activities for that category.
- Get the FTP history from TP (you’ll have to search for that yourself because I don’t know anything about TP). You need a date and an FTP value for each change in FTP. Open the Activity List View in Intervals, change the date period as needed, display the FTP column and check if the FTP changes in TP correspond to those in Intervals, EXACTLY.
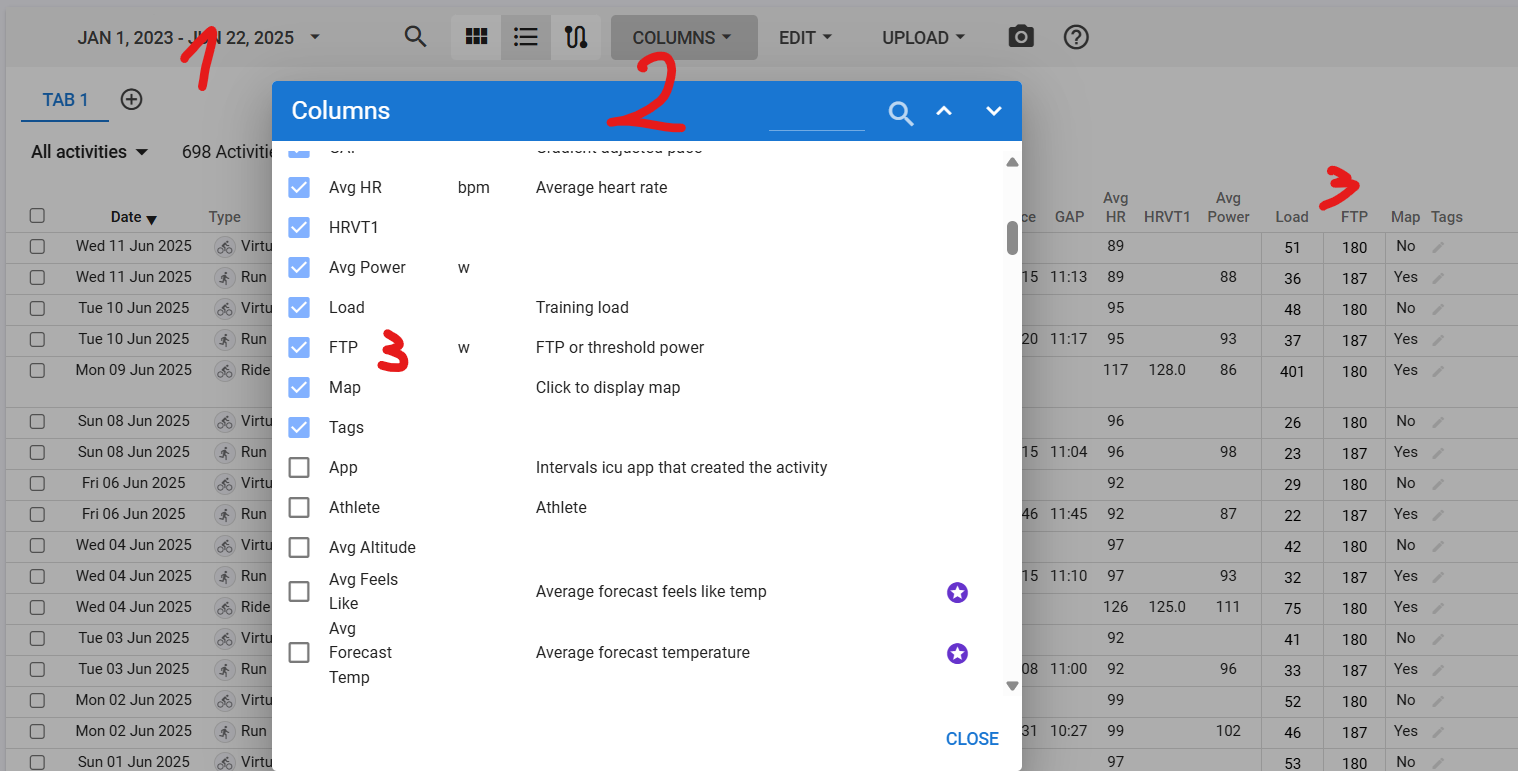
Modify the FTP values in Intervals to reflect exactly the same as in TP. The Edit - Edit option is helpful to modify FTP values over the selected range of activities.
- Now select all activities, click on Edit - Analyze
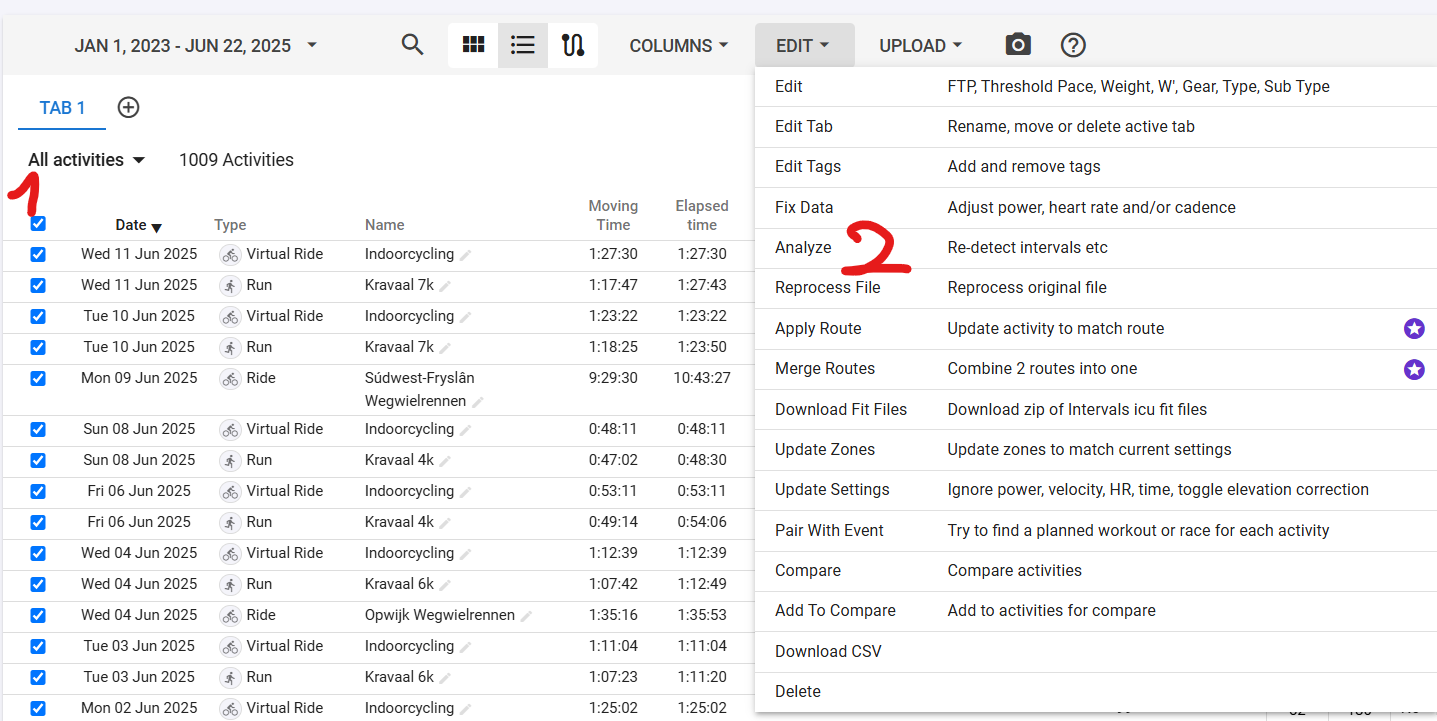
- Check the Keep Intervals checkbox to make sure that all intervals remain untouched and click OK.
Now have some patience and everything (Time in Zones, Load, Best Efforts,…) will be calculated in the exact same way as it is in TP.
You may see some very subtle minor differences because the Form calculation is slightly different. But apart from those barely noticeable details, the Fitness chart will look the same.
If you run into trouble, show us some screenshots of your issues. A screenshot tells so much more then a 100 words…
4 Likes
The update activities you did will update all activity settings to current values. The way I described is when you need to change a range, eg. FTP changed, but the setting wasn’t updated. You can then select the activities after that date it should’ve changed, and it will only update the range.
1 Like
fitness graphs are calculated from Load and load is calculated from current ftp. Depends how often and how accurately did he test, the graph can be more or less precise (in theory). If it is true that he had a pause in training or some weeks with lower volume, just ask him to perform an ftp test (whatever protocol he used last time), the result will be probably 20watts lower then his current set ftp. Each next ride will give him much higher load and a nicer/higher fitness graph and he/she will be happy. I would just use photoshop thou, easier and faster.
" I think part of the problem with clients interpreting a line like this is that it comes down as fast as it goes up, when in the real world, fitness isn’t lost that quickly."
It really depends, look how Pogacar and Vingegard both were struggling to compete after just a pretty short pause in training months before the start. Even with the best possible support, meedics, niutrition, on the third week fitness was just not there. The rule is you need at least 3 times the time of the pause to regain fitness.
Maybe just ask him if he want to be fast or have nice graphs. Training for nice graphs really should be only z2 long rides, nothing more, you can easily build this way to a 120 fitness score. Just tell him not to be angry if a guy with 80 fitness but trained to be fast will destroy him completely
" If they have the same shape to them and look almost identical, the data in intervals.icu should be correct!"
sorry but I have hard time understand your logic. Your client does not like the graph. And just bc he does not understnad and like the graph, we should install strava to evalute the graphs in intervals.icu? I mean at least the graphs in intervals are open and we know the maths behind them. Graphs on strava are probably tss but actually you have no idea what they use bc for example their relative effort score is pretty wonky at best.
@1spooky13 how many hours a week does this client train on average? sorry if I missed this in a post
i stopped for a week. had a crappy week w/ low sleep and this weekend’s ride was hammered. So yeah, this is a “it depends” kind of situation / answer. And it gets worst as you get older. Recovery is slower too and fitness loss also tends to be “felt” greater than it possibly actually is
Appreciate everyones replies. I’m sure this thread will be useful for other coaches too.
I probably didn’t communicate it well but the crux of my question was: Can the data that is used in the fitness line be ‘corrupted’ somehow, by me having messed around with the zones and other settings? Also, how exactly is the fitness line calculated and where does that data come from? Is there any way to double-check that data is correct?
I am asking these questions so I can better understand the workings of intervals.icu and be able to go back to the client (and others in the future) to clearly and accurately address his doubts.
The thing that sparked this off was the client noticing that the mini charts in the calendar had changed following me tinkering with his settings (the next few showed just green colours, even when he was working close to his max power for several minutes). Undoubtably this was caused by me incorrectly adjusting his power zones over that period (I have corrected them, checked all settings - thanks for additional advice in this post - and have ‘Updated Activities’).
Lukasz. You have pointed me in the right direction: “graphs are calculated from Load and load is calculated from current ftp.”. I have gone into one of his activities and after clicking on the activity load figure at the top, this pop up box appeared which I guess definitively answers my questions…
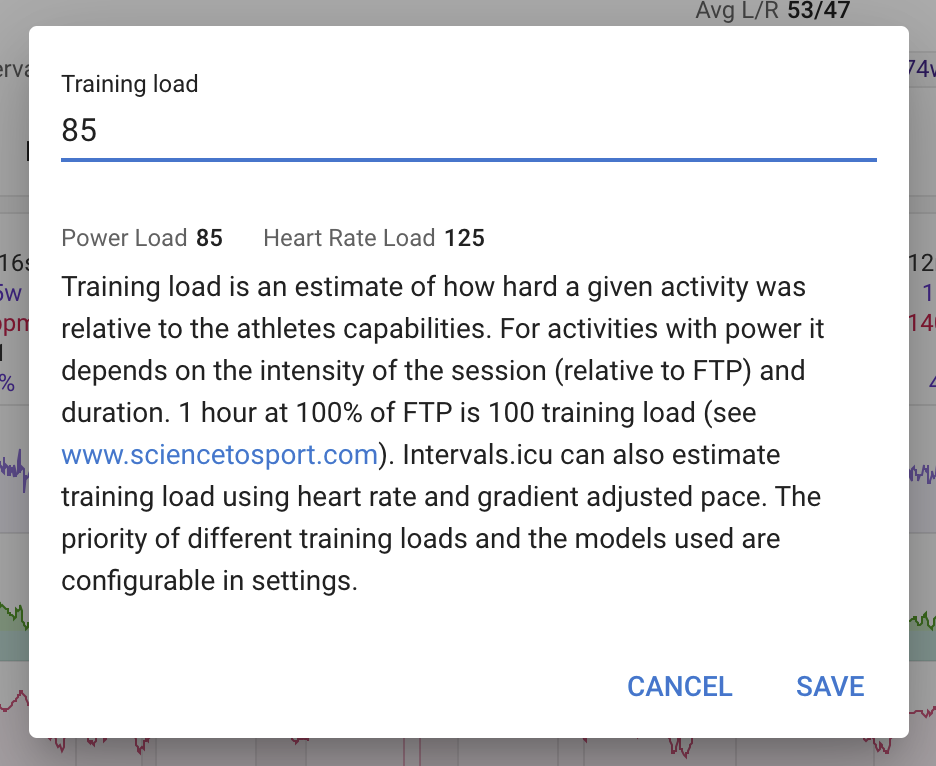
So it appears that only by incorrectly adjusting the FTP can the load (and therefore fitness line) be ‘corrupted’. His FTP is correct (in fact that was one thing I didn’t tinker with), so I am confident in going back to the client and explaining that his fitness line is (and was) correct.
Now the reason for his doubt are twofold: First the the mini charts in the calendar view were incorrect (‘corrupted’ if you like). I think I am correct in saying this is because I changed his power zones, which is where I believe the mini chart data comes from. Now his power zones are correct, the mini charts appear correct and showing the appropriate colours for how hard he is working. Second he ‘believes’ he was working as hard over that period as before but I am sure this wasn’t the case as his weekly loads were down by almost 50% over that period.
I have asked the client to do a new FTP test and for him to activate his free trial with Strava if he still has doubts following the chat I will have with him, where I can now explain where the fitness chart data comes from. The reasoning behind the Strava recommendation is that my intervals.icu and Strava fitness charts are EXACTLY the same shape and so if he sees that too, it will reassure him that intervals.icu’s data must be accurate because intervals.icu and Strava’s data can’t both be incorrect.
So, to conclude, power zones settings (unless you change the priority default settings) affect the mini chart colours in the calendar view and any changes you make to the FTP figure affects the activities loads (and therefore the fitness line going forward). By the way, I tinkered with the zones in the first place for two reasons: one, because I changed my opinion on which zone presets to use and now favour the Joe Friel Bike presets, and two, because the clients max HR was much higher than we had first estimated.
Thanks for everyone’s input.
Zones don’t directly impact the fitness/fatigue lines. They represent how relative the effort was to FTP/LTHR. Normalized watts (NP) and Intensity (IF) are both used, relative to FTP, to calculate the daily load. If the zones are incorrectly set up, the intensity of the ride could be easier/harder than intended, but it doesn’t affect the two lines. If FTP is correct, which you have said it is, and you have the default power levels selected, then the Load (TSS in TrainingPeaks) should be relatively good to use.
Yes, upload the exact same data into TrainingPeaks, make sure that the settings (FTP, zones, LTHR, etc.) are the same, then look at the values. The formula for fitness and fatigue are:
- CTLtoday = CTLyesterday + (TSStoday - CTLyesterday)(1/CTL time constant)
- ATLtoday = ATLyesterday + (TSStoday - ATLyesterday)(1/ATL time constant)
You can also use Excel:
-
Download the activity.csv file from Activities page - Options - CSV
-
Open the CSV file in Excel
-
In a new Excel file, create a date range (oldest to recent order), like in my example.
-
Add the training load for each day, either through a lookup formula, or manual entry for each day.
-
Calculate the fitness and fatigue each day, using these formulae:
Fitness=E24+($C25-E24)(1/42)
Fatigue=G25+($C25-G25)(1/7) -
Add the opening fitness and fatigue values for row 23.

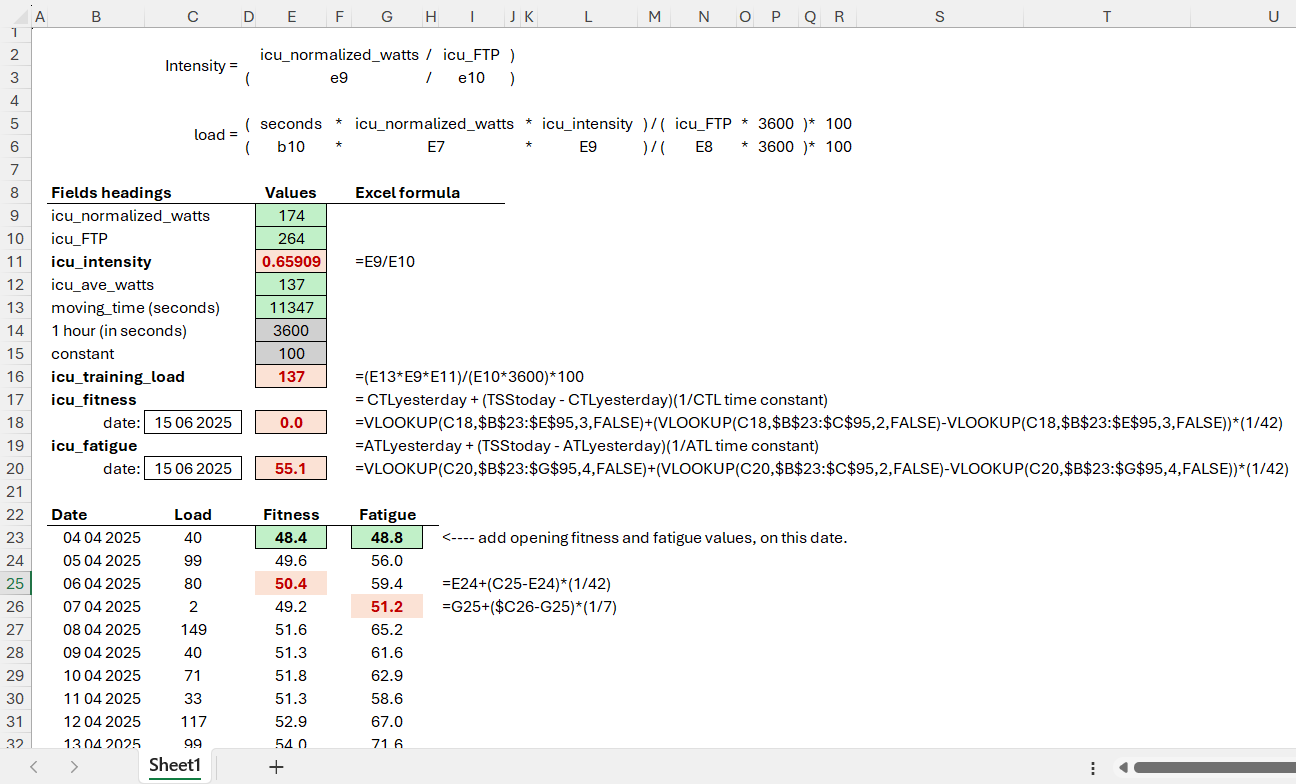
Here’s the excel file - in Google sheets.
Save a copy, then change as it suits your athlete’s data.
1 Like
I find the HR zones for Joe Friel presets to be too high for Z1-3.
LT1 is lower than the top of Z2, so I prefer using the Coggan 5-zone model, and then customising Z2 to be closer to LT1.
Also, if your athlete is using power and HR for cycling, you could use Time in Zone settings instead of HRSS. This will give a closer match of HR calculated load when power is not available.
2 Likes
I will complicate the things a bit but maybe it will help. Each activity is a recording of power and hr and from that the load is calculated taking into account current zones (ftp, lthr). But ofc you can change zones like for example after an ftp test. So two 1h activities at 200w can have different load just bc the setting of ftp was different. So for exmple his ftp was 200w so it would be 100 tss but the second activity was done after the test with updated zones and lets say ftp of 300 so the load would be only 75 tss. And to complicate it even further intervals has one ftp and hr setting for one athlete meaning each activity is remembering ftp it was done with and the load is calculated from that and if you change your ftp it is changing only into the future rides. BUT there is an option to recalculate the past activities to current zones and if you did this by accidnet or just by looking around, and his activities before the ftp test were done with much lower or higher ftp, after recaltulating everything into new ftp, the resulting graph will look much different. So the correct way of solving the issue would be probably to ask him what were his ftp setting before the ftp test, set that ftp in intervals and recalulate all his activities, then set his new ftp from the test and on a list view select only activities done after the ftp test and recalculate them with new ftp zones
ps. the debate friel vs coggan is like neverending story, in short the difference is mostly around top of z2 and in theory coggan is more bike oriented and friel leans towards running but only a proper lactate test can tell where his lt1 is.
“because the clients max HR was much higher than we had first estimated.”
again much better to calc hr zones from lthr, maxhr is hard to set correctly
ps2. not sure what you all mean by correct ftp bc at least my ftp changes by 50 or so during the season ( peak vs offseason)
ps3. “Second he ‘believes’ he was working as hard over that period as before” I mean this is a loophole I think. From my experience, if I do a tempo block for example wtih proper progression, 3x15min z3 will give me same rpe as a 1h z3 but done two weeks into the block (and from a calendar point of view there is no chance they look the same ![]()
1 Like