HI all,
I’m new to Intervals.icu and have recently got a Polar watch and chest monitor (H10).
I’m not a runner. I bought the Polar gear to try and get fitter from the gym and train a bit more efficently.
I don’t really like Polar Flow (the Polar app). I find it hard to easily see how I’m doing in terms of my resting heart rate (RHR), HRV, and what might be affecting those over the months.
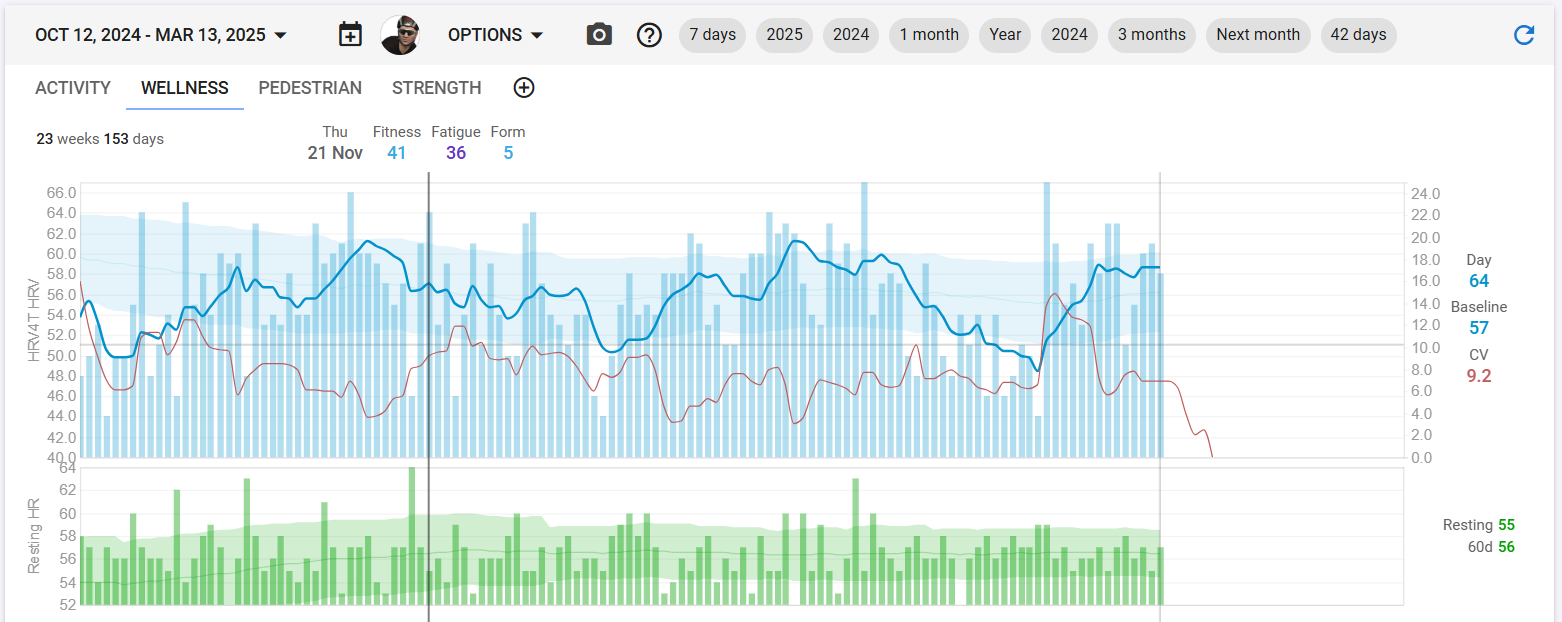
I see with Intervals.icu I can make my own custom charts/graphs showing HRV, resting heart rate, and other things over time – this is great!
However, I’m not sure exactly which metrics to add to the graph and how to organize them so I can get a good overview.
Any tips?
Ideally, I’d like to see if my sleep and exercise are having an impact on my resting heart rate and HRV and also see if my RHR and HRV are going up or down over time.
Thanks