Is there a way to create a chart or a table or something that lets you track your wellness data (injuries/sickness)? Something that can be expanded years back in time.
Seems like I can do this on the fitness chart, but the yellow sickness “blobs” are hard to see if they are overshadowed by the fitness curves, and if the range is big.
My use case for this would be to hopefully learn from my own mistakes. My injuries are rarely new, I’ve had similar in the past. Would be great to compare notes from those times. Rehab exercises, rate of pain etc.
1 Like
Same question from me. I track injuries two ways
- add wellness calendar entry without details, only the 1-5 scale
- add calendar entry “injured” with details and duration etc
My problem is how to list those entries over time? I need a view, list etc something
Gabor
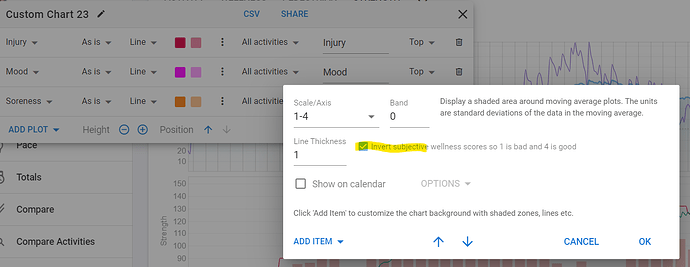
Injury, Soreness, Mood, etc (the subjective metrics) can be plotted just like any other parameter.
Just make sure to open the three dot menu and invert the scale.
Calendar entries like sickness are notes and I don’t think you can plot those.
Thank you. So i can put into chart, i see. My real need is to list date intervals, days with sickness, injured over time. Would be good some kind of filter for custom calendar entries.
Gabor
1 Like
So maybe it is a feature request? List of injuries, injured intervals?
1 Like
