If you change the Measure on a Chart Plot e.g. ask Intervals to plot Moving Time instead of Distance, other items on the plot get updated / reset.
Namely the Calculation Method gets reset to Weekly Total, Plot type is reset to Bars, and the colours get reset
Is it possible to change this so these all stay the same? I setup some graphs and wanted to duplicate them and change the measures (so I could have the same graph layout showing load, distance and time), and it is much harder than it needs to be because when you change the measure everything gets reset, so you pretty much need to recreate the graph from scratch
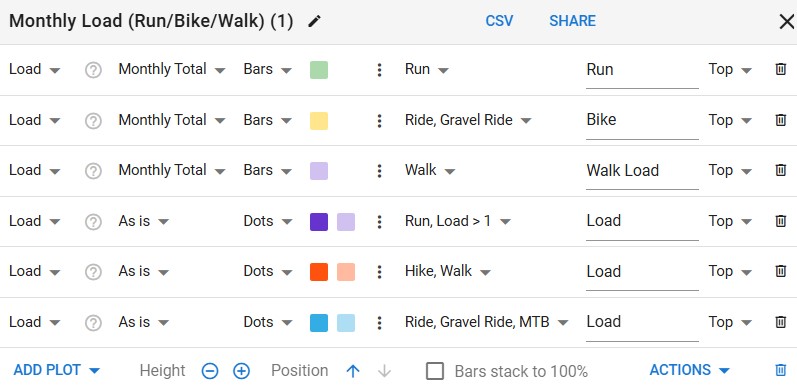
example showing the impact of changing the first plot to Moving Time. Note colour doesn’t alter because this must be the default colour for Moving Time
