Is there a way to see “workout target power” vs. “actually achieved power” in the data tab of a cycling activity?
E.g. Showing something like this where (1) the second-to-last last column comes automatically from the workout file and (2) the last column is automatically calculated?
Interesting idea. Out of curiosity, I created a chart using the “formula” plot and it was quite easy to achieve this. However, the data tab fields only support JS scripts.
To the developers: wouldn’t it make sense to also have “formula” available there?
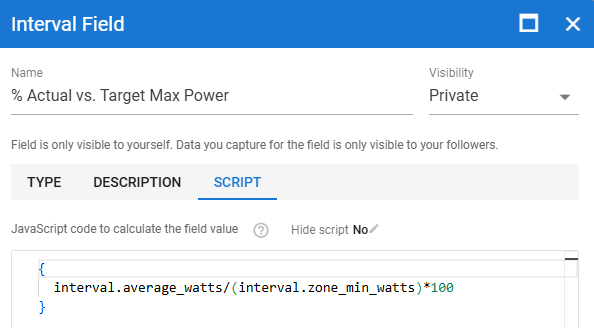
I used @ohmax 's approach of creating a variable by pasting the script in the box at Activity>Timeline>Field>Add Field.
The ‘syntax autocomplete’ worked. And the box showed a value of 78% or whatever in the “Add field” box.
But, the calculated values do not fill at the activity page, either in the timeline tab or in data tab. The column is present, it’s just that all the values are blank.
I tried clearing the intervals and resetting them using the auto-created laps from the workout (Garmin) and still nothing.
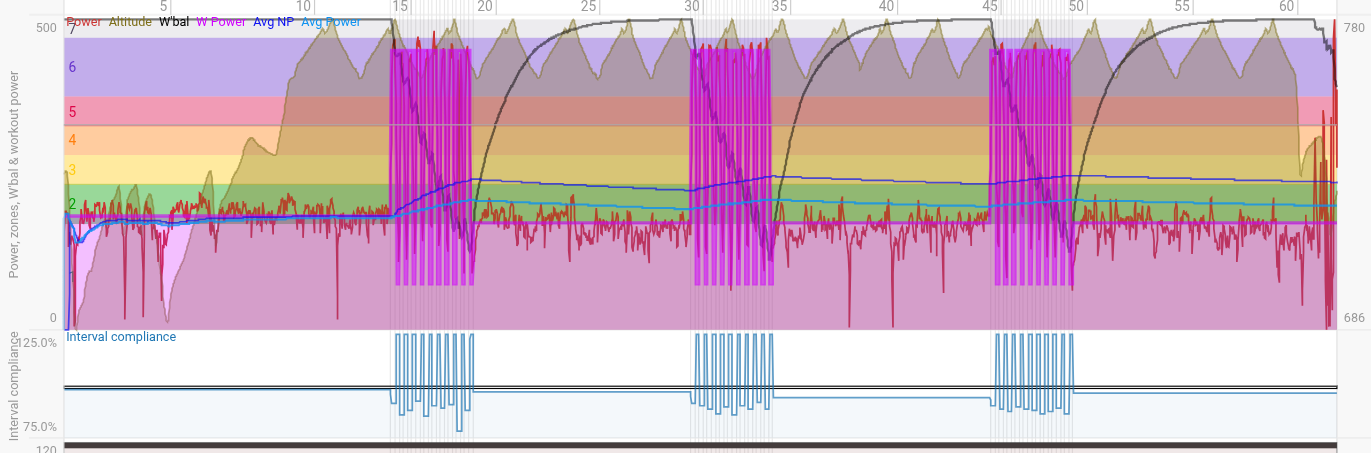
I know this isn’t what you are looking for, but as I mentioned before, I found your suggestion interesting and ended up creating this chart, which I’m already finding very useful.
It’s available under the title “Interval Compliance”. I use it right below the power chart with the workout power overlay (must be properly align the workout using the Options menu at the bottom of the page)
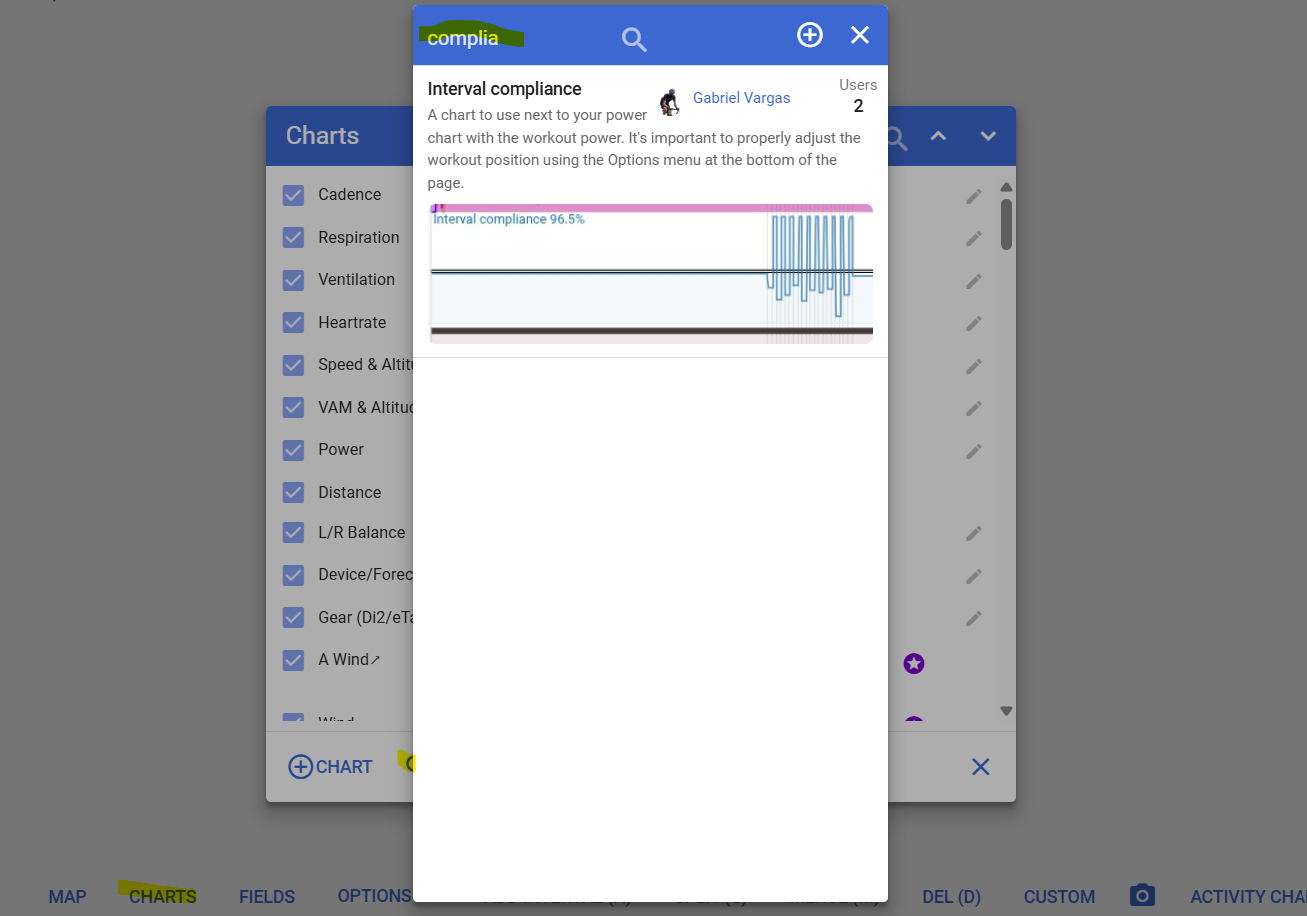
Your chart would give me a view of the data I was looking for, but I wasn’t able to add it to my power tab. I’m not sure if it’s me or something else because I haven’t used overlaps or tried to ‘properly align using the options menu before.’
I went to the bottom of the power tab, clicked ‘Activity Charts’ and searched under ‘Chart’ and “Panel” for “Interval Compliance” and ‘workout power overlay’ but neither came up. Any thoughts?
I did find: “Time in Zone Per Interval (Table)” while searching. This calculates the % in each power zone for each interval (presumably from your power zones set in user settings). So, it provides the number I was looking if my interval target overlaps the entire power zone range (e.g. something like VO2) but probably isn’t narrow enough for something wide like Z2 where a target zone might be high Z2 or low Z2. However, it may be of interest to some people.
Thanks for the help everyone. I got the chart working which is helpful.
I did try to get the interval data table solution to work, but it doesn’t appear possible? As best I can tell the right data structure to access workout target power may be:
interval.plan_min_watts / interval.plan_max_watts which both show as null for my paired workout
interval.plan_watts is zero
interval.zone_max_watts / interval.zone_min_watts are “other” numbers but (for my workout) don’t appear to be the workout target (or even my max/min outputs for the segment)
And any other watts value I explorer are null or are actual performed watts.
 Not sure why I need to use min_watts though to have correct calculation.