Hi,
Is there a way to get a best VAM on specific duration (e.g. 5m, 1h) or elevation (100m, etc) over a period of time (e.g. current year) ?
If it’s not native is this something that can be calculated somewhere ?
Thanks !
Hi,
Is there a way to get a best VAM on specific duration (e.g. 5m, 1h) or elevation (100m, etc) over a period of time (e.g. current year) ?
If it’s not native is this something that can be calculated somewhere ?
Thanks !
Not natively.
You could create (for each duration you want to track) a custom field and calculate these per activity. You can plot those custom fields in the fitness charts or sort on the activity list.
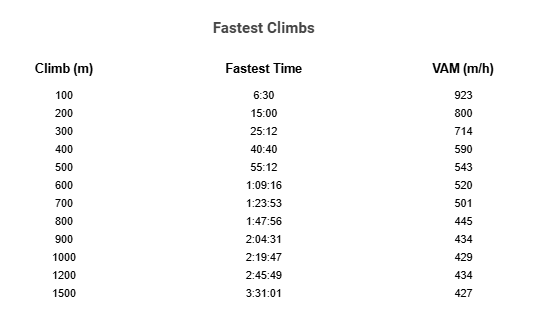
I created this very simple activity chart table. Is this what you are looking for?
I made it public, if you want to take a look.
Thanks. I can’t code , how does one make a chart based on this that can show progress over time (like the best efforts chart) on VAM. To compare if you’re actually climbing faster overtime.
Thanks for the replies. Actually I’m more looking for a “fitness” chart than one inside activity because I’d like to check on what activities/climbs my best VAM were
Maybe create a custom activity field with the VAM100, 200, 300 etc, and the plot it on the Fitness Chart?
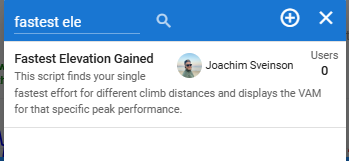
Activity → DATA tab → ACTIVITY CHARTS → Search for “VAM Peak” → Apply.
That’s it.
Very nice and useful.
Code:
{
const stream = icu.streams;
const maxTime = icu.activity.moving_time;
console.log(Total moving time: ${maxTime}s);
let intervals = [60, 120, 240, 300, 600, 1200, 1800, 2700,3600, 7200, 10800, 18000];
intervals = intervals.filter(interval => interval <= maxTime);
let vamPeaks = ;
// Monotonic elevation gain (cumulative)
let cumulativeGain = ;
let gain = 0;
let altitude = stream.altitude;
let startIdx = 0;
while (startIdx < altitude.length && altitude[startIdx] <= 1) {
startIdx++;
}
if (startIdx > 0) {
altitude = altitude.slice(startIdx);
}
cumulativeGain[0] = 0;
for (let i = 1; i < altitude.length; i++) {
let delta = altitude[i] - altitude[i - 1];
if (delta > 0) gain += delta;
cumulativeGain[i] = gain;
}
// Best VAM calculation
intervals.forEach(interval => {
let best = 0;
for (let i = 0; i < cumulativeGain.length - interval; i++) {
let j = i + interval;
if (j >= cumulativeGain.length) break;
let deltaGain = cumulativeGain[j] - cumulativeGain[i];
if (deltaGain > best) best = deltaGain;
}
let vam = (best / interval) * 3600;
vamPeaks.push(vam);
});
// Convert to minutes
let xValues = intervals.map(sec => sec / 60);
let xLabels = intervals.map(sec => {
if (sec < 3600) return ${sec / 60} min;
return ${sec / 3600}h;
});
// Plot
let traces = [{
x: xValues,
y: vamPeaks,
type: ‘scatter’,
mode: ‘lines+markers’,
marker: { color: ‘darkorange’ },
line: { shape: ‘spline’ },
name: ‘VAM Peaks’,
hovertemplate:
‘%{text}
VAM: %{y:.0f} m/h’,
text: xLabels
}];
let layout = {
title: ‘VAM Peak Chart’,
xaxis: {
title: ‘Duration’,
type: ‘log’,
tickvals: xValues,
ticktext: xLabels,
tickfont: { size: 12 },
tickangle: -90
},
yaxis: {
title: ‘VAM (m/h)’,
tickformat: ‘,d’,
tickfont: { size: 12 },
rangemode: ‘tozero’
},
margin: { t: 50, l: 60, r: 20, b: 100 }
};
const chart = { data: traces, layout };
chart;
}