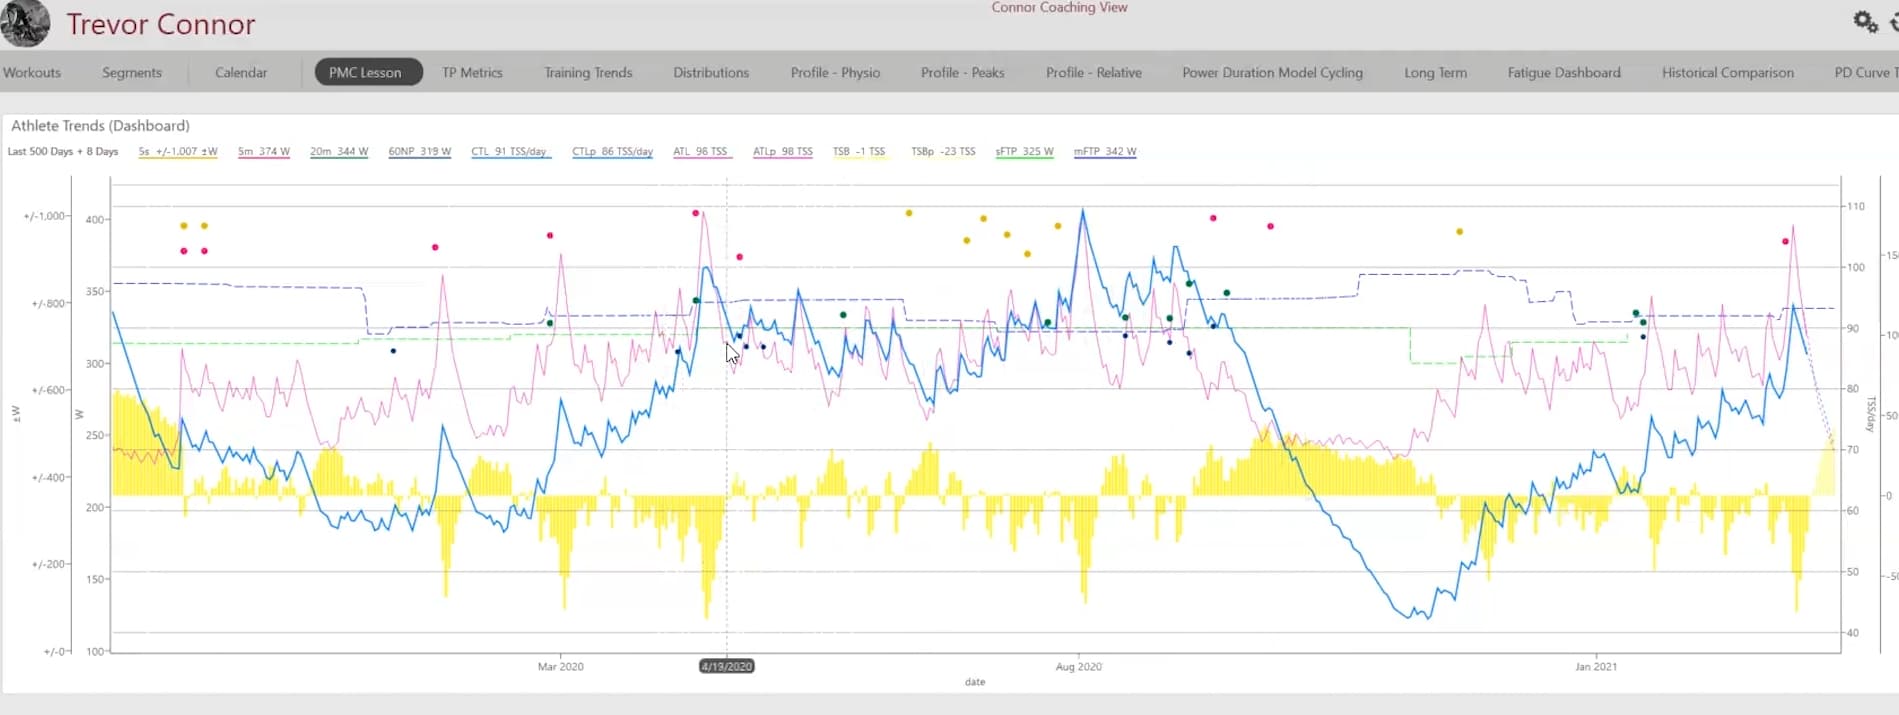
I was just watching the latest free content from Fast Talk Labs on how to use the Training Peaks PMC (Intervals.icu Fitness chart essentially).They showed the PMC with the best 1s, 5m, 20m, etc power plotted on the graph (coloured dots in the below screengrab).
I think being able to plot our Best Efforts from the Power page in Intervals on the Fitness graph would be great. If they could each be plotted as a different colour and when hovered over the data shown (duration + power), that would be fantastic.
Would this be possible?