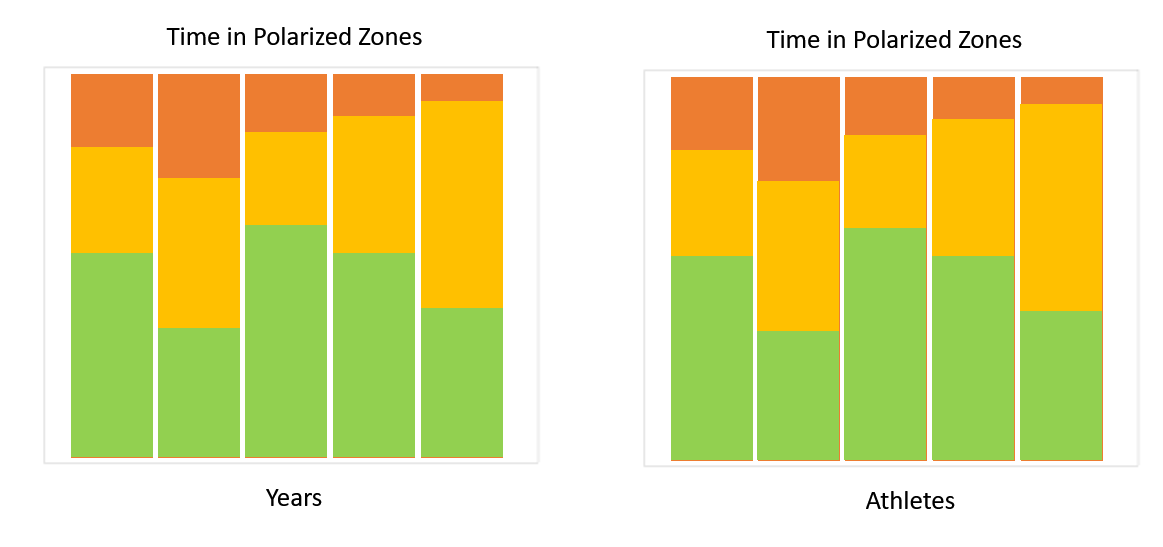
Perhaps the Compare functionality could be extended to allow for bar graphs. I think currently dots and line graphs work and the years or athlete are always the third dimension in the graph.
Would something like the screenshot below be possible? Probably not trivial to implement, i suppose?
Hmm,
following the currently implemented way in which seasons and athletes are compared it seems we would expect NxM stacks of three bars grouped by the first of the two dimensions if N seasons and M athletes are compared. That could get a little messy.