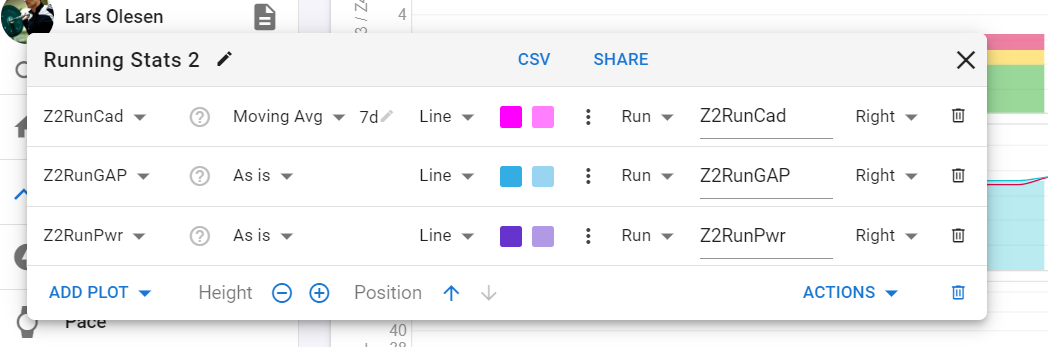
Also, I cannot quite figure out which values are on which chart, as I have three plots, but right axis and left axis only has one label (which I have not set).
Each plot has a scale (click the dot dot dot menu to see) which can be edited. Plots with the same scale share an axis. The scale is left, 2nd is right and others are hidden (still work but no axis plotted). You can make the right axis label a space " " to hide it and not overlap the values.
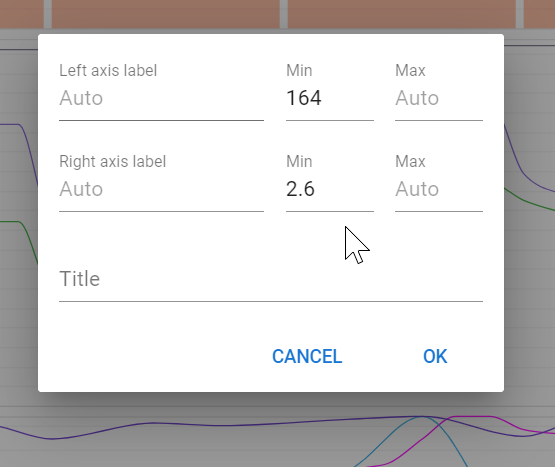
I’ve tried setting a space for the Right axis label, but the axis still persists.
Ah never mind. Setting it to space, hides the label. But I wanted to hide the values of the axis, so that it doesn’t cover the inline cart values that are on the right as well. But after a second look, they don’t seem to overlap with the right inline values of charts, so it’s fine.