Any way to see time at cadence below a certain threshold?

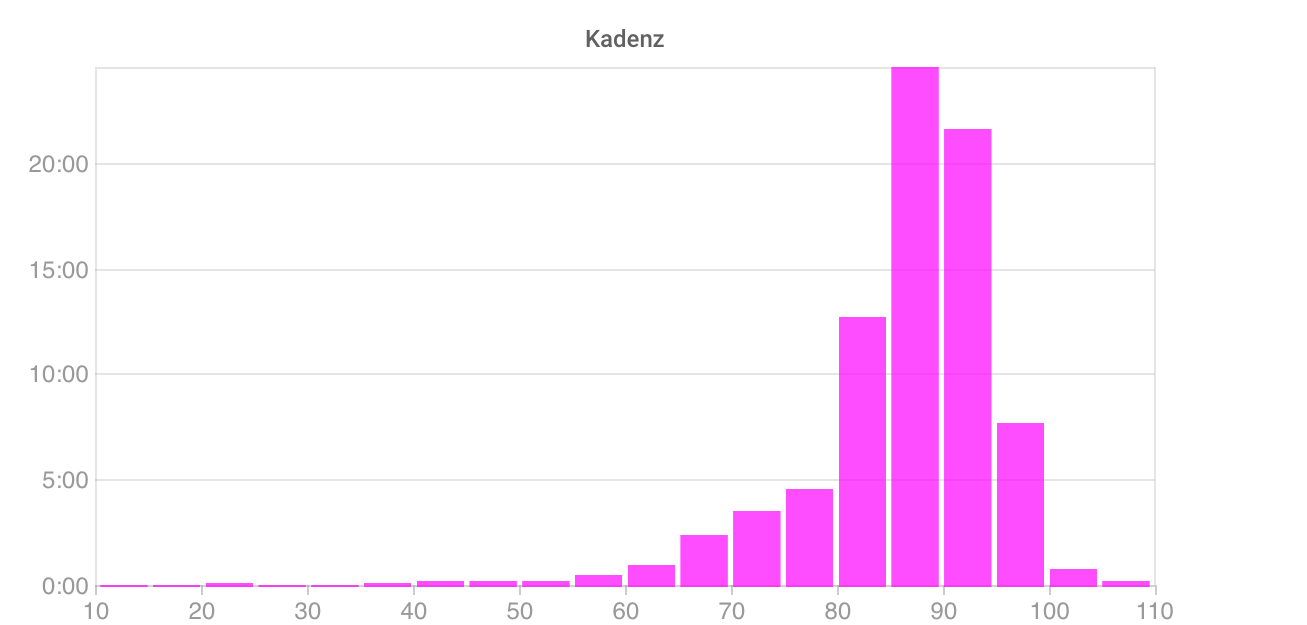
Is there some way to see how much time I spent under eg. 85 cadence during a ride (Excluding zeroes)?

I am trying to teach myself to ride at higher cadence and would like to see, how much time I still end up grinding, since it seems to be my default once I’m tired…

You could plot Cadence as histogram

If you want a number, you could create a custom script field, like

{
const cad = streams.get("cadence").data;
const seconds = cad.filter(value => value < 85 && value > 0).length;

seconds;
}

and convert it to a time

The histogram is a great solution, thanks. Didn’t know I could do that, but found out how. So many more options with those extra charts.

1 Like

Here is late in a ride where I was doing 5 minutes intervals above 100rpm. Showing last interval on the left, power top chart, cadence lower chart:

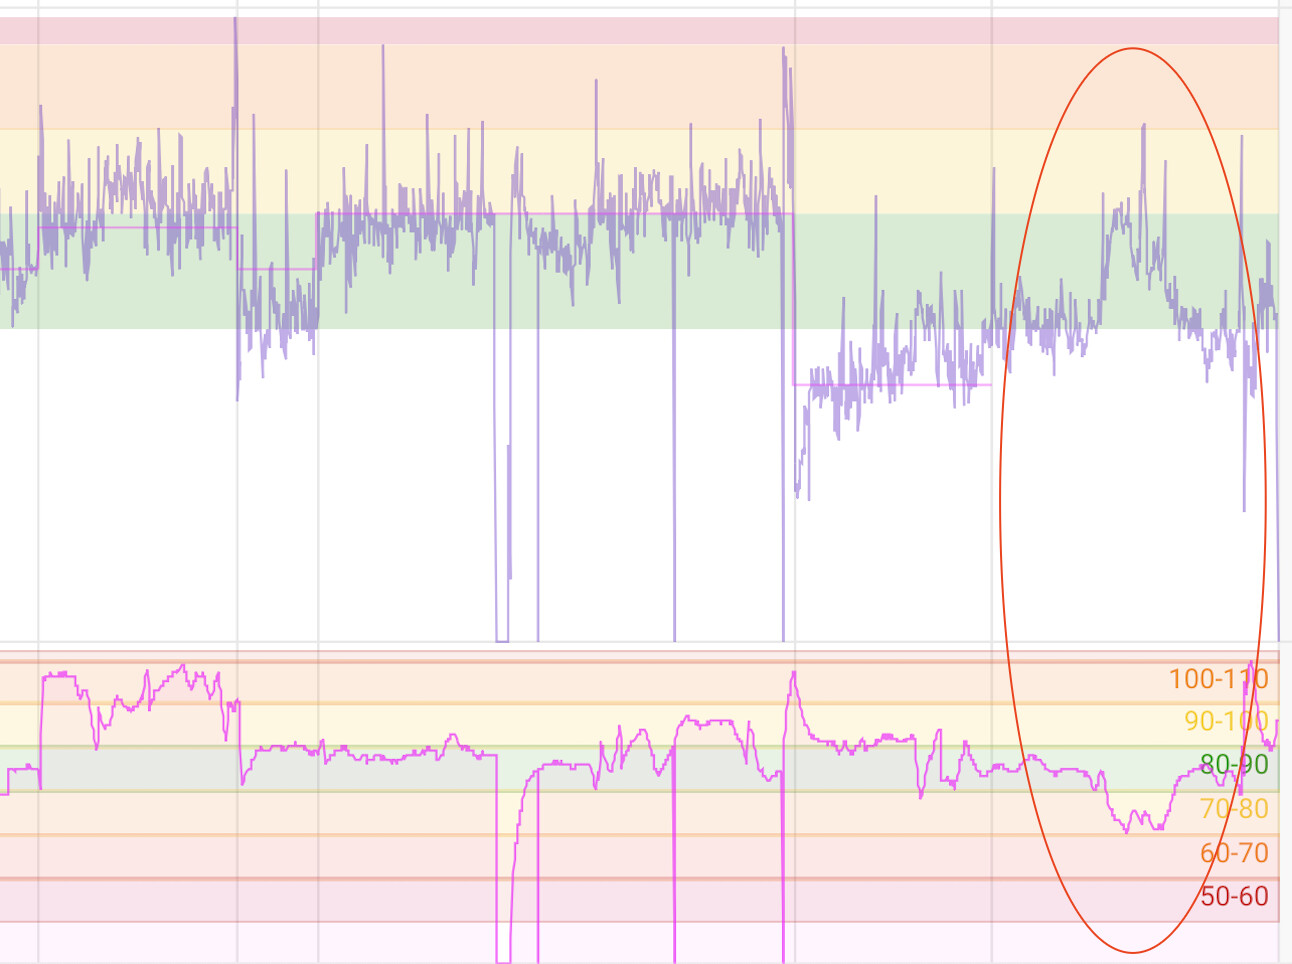
looking at bottom chart its really easy to see that after the 100-110rpm interval, I hung on to 88-90rpm and then near end got tired and dropped cadence to lower 70s (highlighted in the red oval).

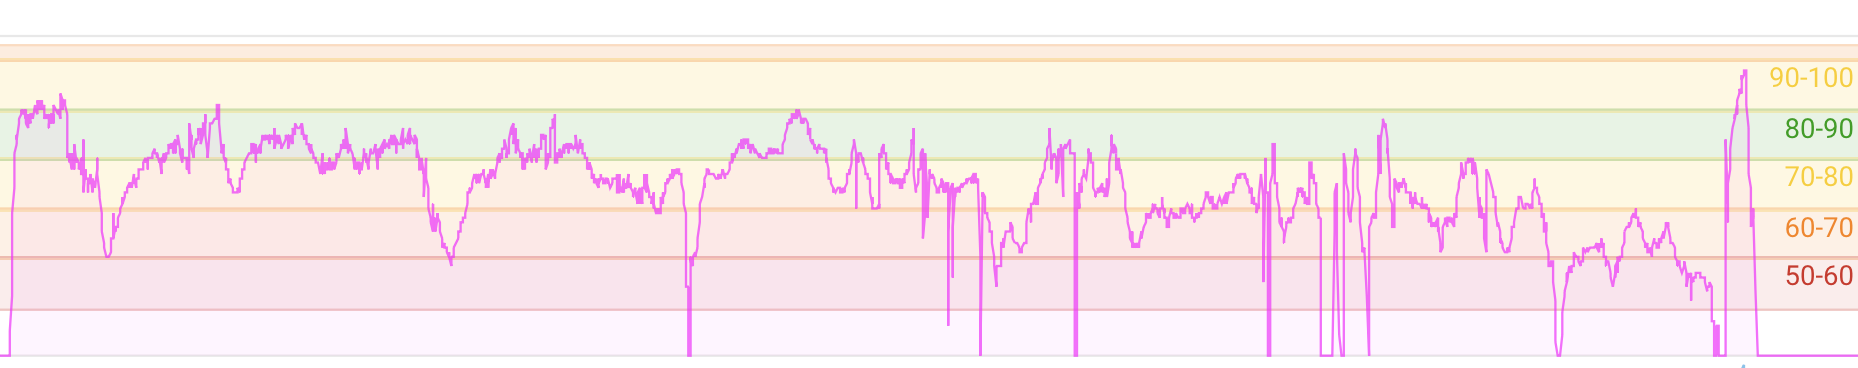
Last 30 minutes of a really hard group ride after getting dropped:

Cadence keeps dropping and dropping and dropping…

Its a Custom Cadence chart in Intervals:

click on Options (3 vertical dots) and add bars, these are every 10rpm:

In addition to histogram and colored cadence chart, the other chart I use in WKO is meanmax(cadence) but that isn’t possible to do in Intervals (yet).

1 Like