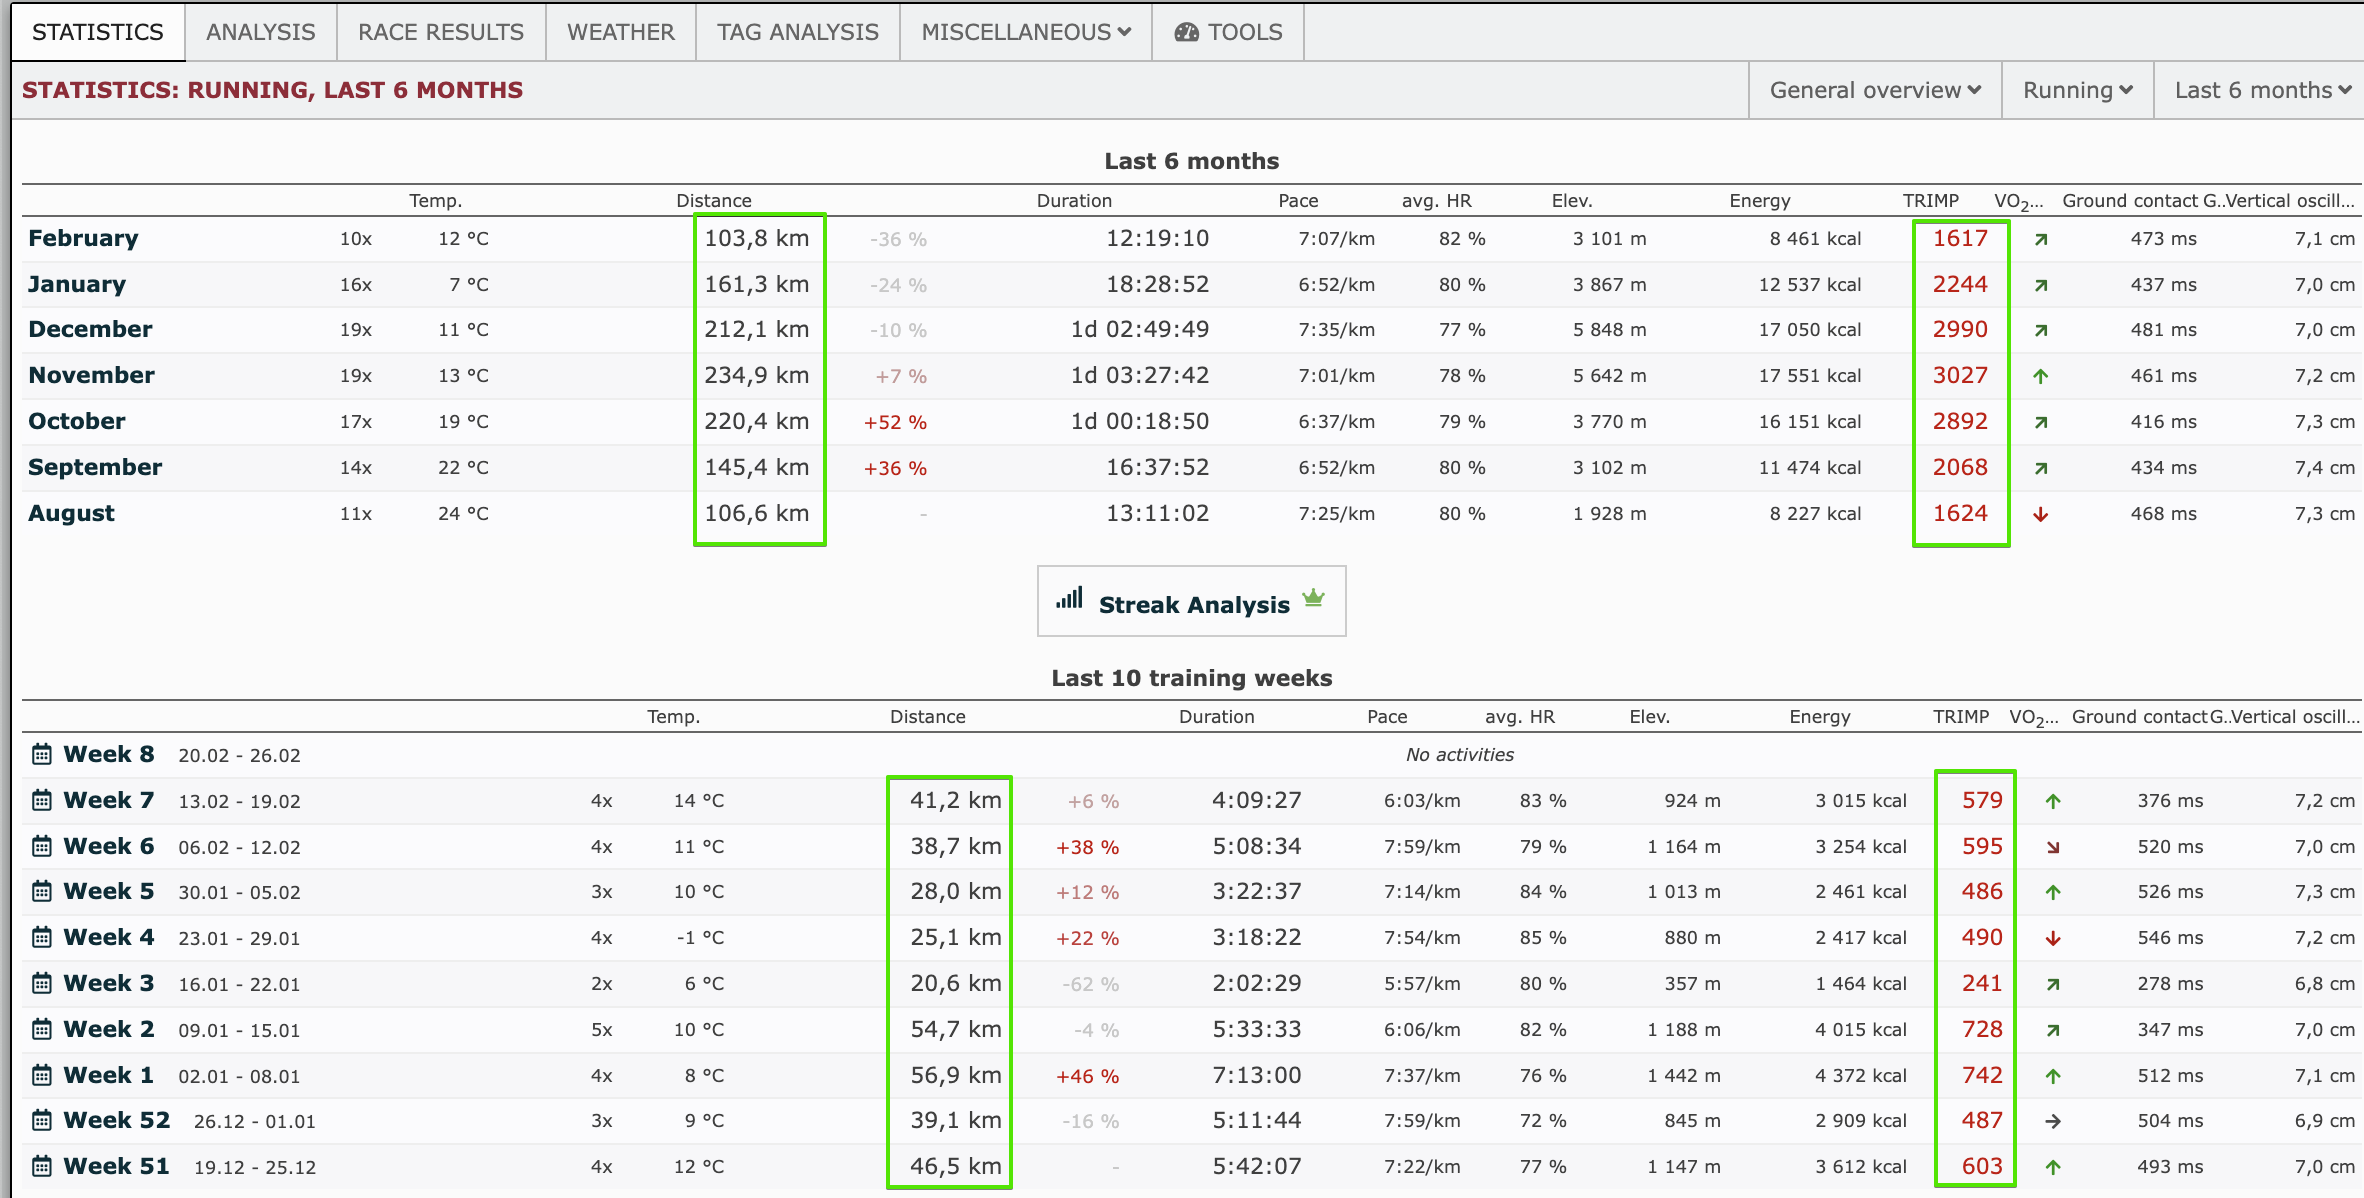
This is one feature I’m missing on intervals. I easily see distance, total time and load per week/month. I know we do have the chart page, where I can add bart chart,s but it’s not visually alike.
Any way to build something like that on the fitness charts page?
Not yet. But one of the things on the roadmap is to support custom plots done in Javascript working with longitudinal data. Like the custom activity charts but over a time. Then it will be possible.
Not yet. I have been thinking about how to do this a bit and probably adding a table view option to the /fitness tabs would work. Would need to have selectable columns, show week/months other stuff so fair bit of work. But I think it would be a valuable addition.
I am going to be working full time on Intervals.icu from 1st September and will be able to do a great deal more development.
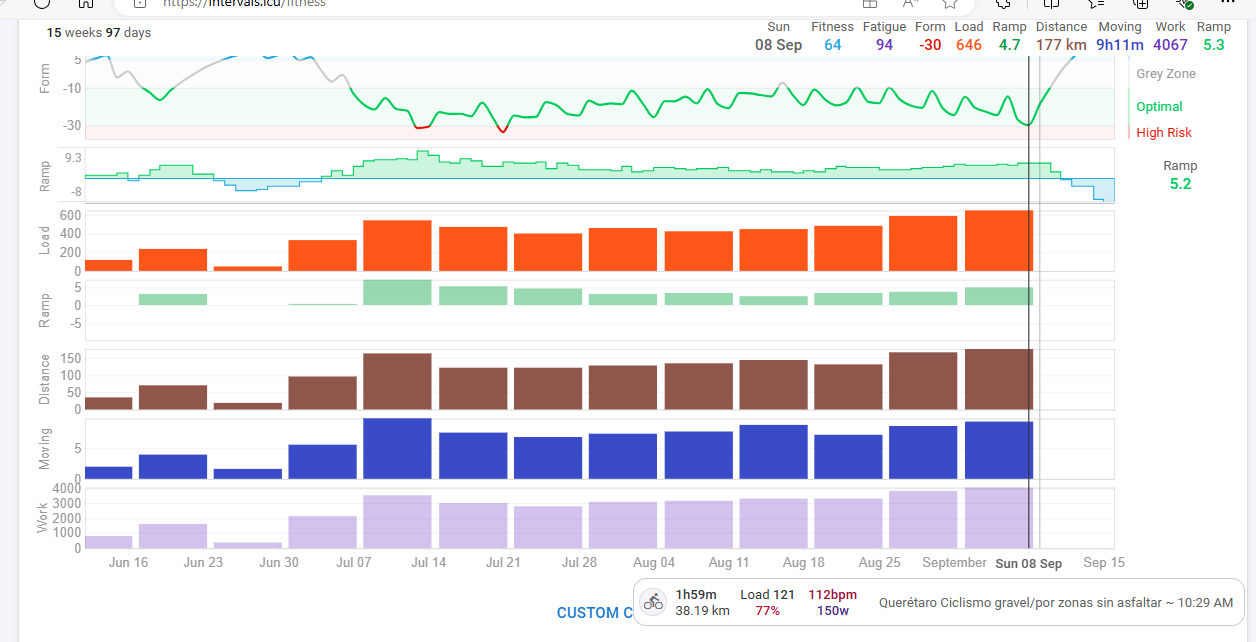
I used another method to get the information I was looking for. The idea of the totals table was to track how I am applying the overload principle using several variables such as load, ramp rate, time, distance and work.
I created a second tab in the fitness chart and added custom charts for each of the variables using the weekly totals option. This shows both the graphic trends as well as the total values at the end of each week. Good enough for me.