Is there a way to see a total annual time spent in power zones? I feel like it would be interesting to compare this year-to-year. Is it also possible to see a comparison of average time spent in zones between indoor and outdoor training rides?
I could do that for the season on the power page which already supports indoor/outdoor filtering. Have added it to the todo list. Tx.
I don’t see where you have ever gotten around to this. With all the Polarized talk, I’m surprised that I can’t find this feature available on any platform.
Its next on the list. I am going to make the “weekly popup” into a “page” with date range selectors and space for a lot more info. Have to track down the latest round of bugs first.
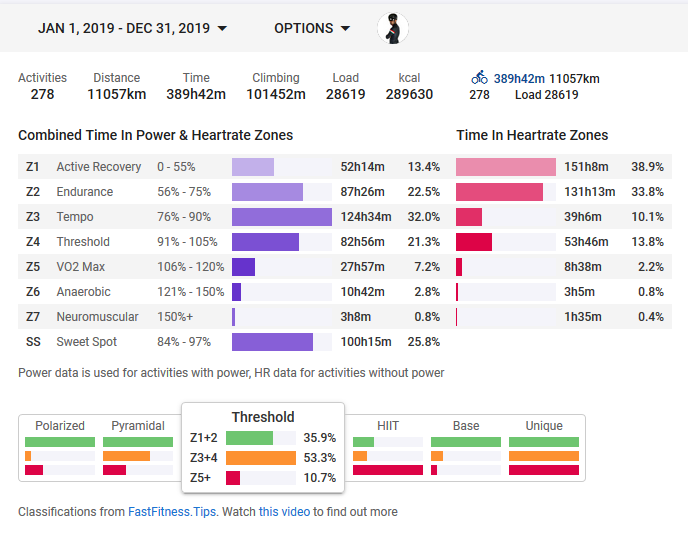
Work has started. Its a pain trying to fit everything in and choosing the dates will require some work. This is me in 2020 so far:
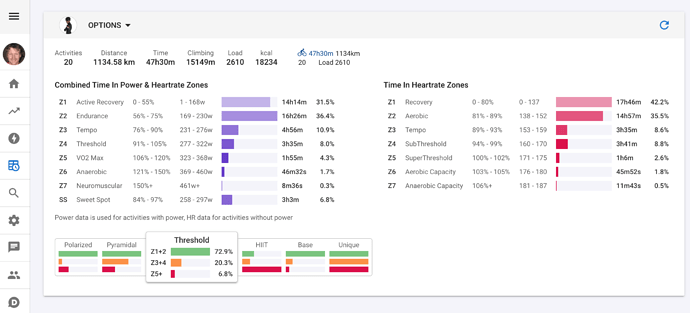
Do you guys think it is worthwhile to include the watts and bpm ranges for the zones? These will be for the most recent activities in the time period. And I will have to split out indoor and outdoor zone ranges for power if someone has different indoor/outdoor FTP.
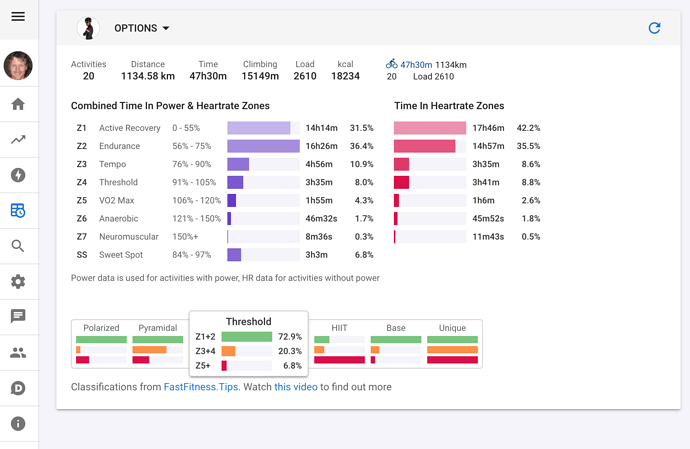
Here is a version with the HR zone labels, watts and bpm ranges all gone. I am leaning towards this because if you pick a big timeframe your FTP will have been changing anyway.
I like this version much better. Split in outdoor and indoor is oké but for me not the first priority to build I think. I would like to see, somehow, a graph showing power against heartrate.perhaps the bandwidth of heartrate for certain power(range).
Yes, I like to see the actual ranges in the page. very informative.
I’m still unsure why we would want to have different indoor and outdoor FTP. If you decided to go ahead and split out the pages, then there should be an option to combine, either through a selection, or for all that have it setup to be the same.
I agree. Splitting it should not be a priority and there should be the option to not split it.
Indoor FTP is used and normally lower, because many are not able to complete workouts indoors, like they would outdoors.
This is due to several factors, but most important are cooling, hydration and static position.
You can obviously take measures to counter each of the effects, but the combination (still) makes it hard to compensate 100%.
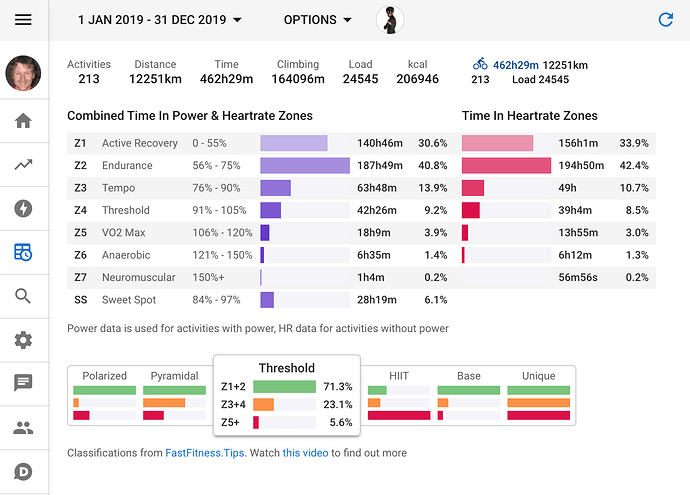
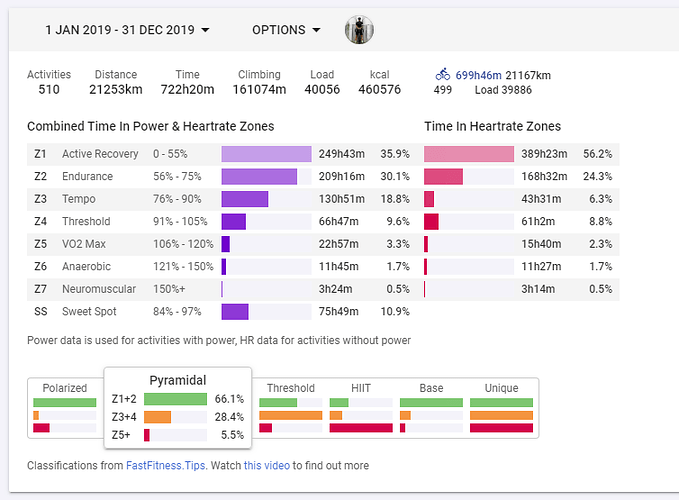
The first version of this is live now. I need to do a lot more filtering in options (different activity types etc.) and many other smaller things (e.g. watts and bpm ranges as option) but you can use it right now. My 2019 stats: Interesting how similar the power and HR bars are.
would be useful to see on this total page what it thinks athlete type you are for the stats: E.g. TT, all rounder etc. Spider chart style would be even better to compare against other interval.icu users?
Highlights the lack of v02max in a year 
You can see your rider type on the /power page. I am going to add age group based comparisons to other users soon!
Another thought here as well, in a similar way veloviewer allows you to create end of year image for upload to social media or strava etc, you could also do the same for this, Another good Intervals.icu advert as well.
Thats an excellent idea! Have to get on that!
Since we have a lot of space on this page, I’d love to see the actual numbers for watts and bpms. Recently I had my zones reassessed and I don’t understand if these percentages follow the changes in zones
Thats definitely going to happen. I just paused it to get something live.
This is done now (click “Options”).
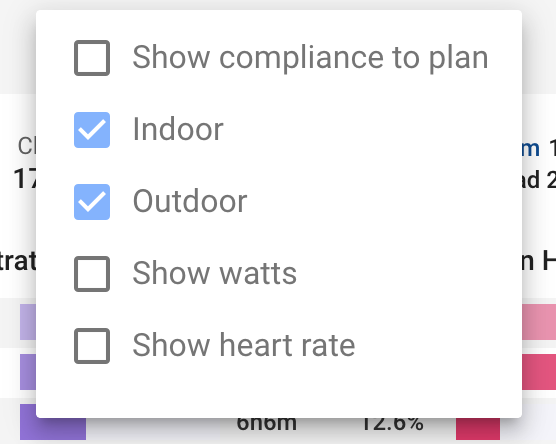
Seems Like Watts are even shown twice.
