Many thanks for your comprehensive reply.
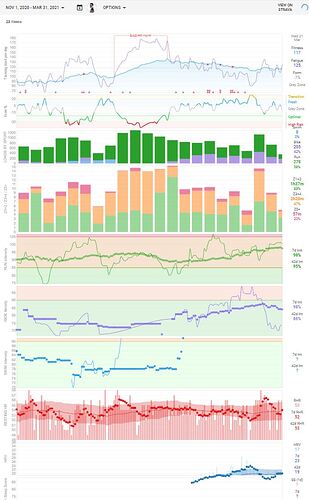
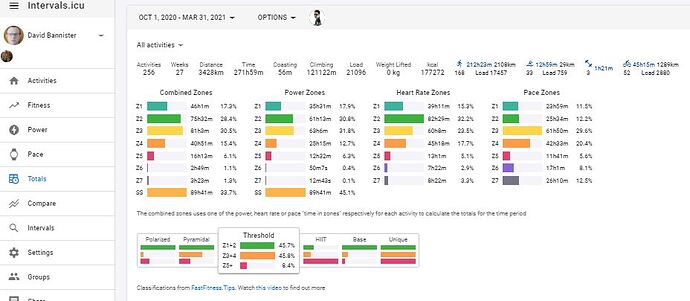
I have attached the CIL graphs that you asked for and broken them into the various disciplines. The first one is the period around the month of HMs that I have discussed in other posts. The swim was presumably curtailed by lockdowns I think hence that suddenly disappears.
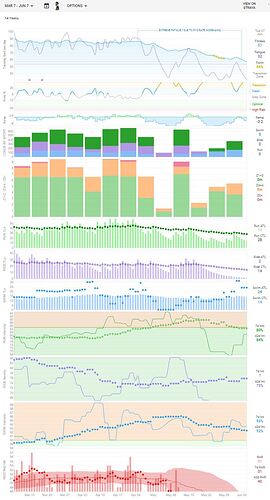
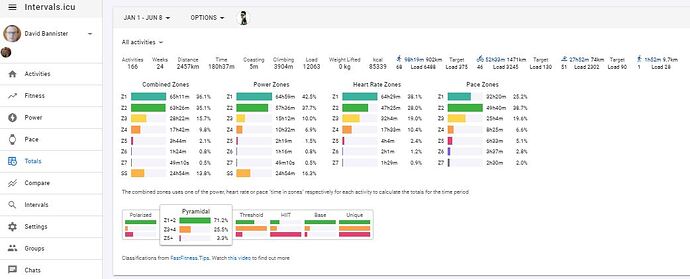
The second is for the recent 3 month period with the cliff edge exhaustion illustrated.
I cannot disagree with the sensible periodisation that you outline & confess that my drip drip approach is sub-optimal & probably not advised as you demonstrate.
I think that I will go back to having particular events on which to focus my training loads & rest periods even if they are not what particular motivates me. It will discipline me into periodising.
The confounding factors (though perhaps excuses) to me doing that are partly that rest above e.g. 2-3 days has always left me lethargic rather than reinvigorated. Perhaps that is just an addict avoiding cold turkey. As I say my subconscious definitely over rules my physically sensations. Hence I tried to use objective rather than subjective data.
The HM month surprised me in that my RHR seemed pretty good & trending down throughout & also after that intense period, & remaining within the 0.75 SD band, though I accept in late March it did go haywire. So perhaps Feb was just the RHR lag before the reality with hindsight. That likely was the reason that I carried on doing lots of Z3 despite reducing the total weekly load. The fact that my HR remained within “normal” i.e. coloured band was why I increased my weekly loads back up & the Mid-March RHR does indicate that I needed to rest longer , which I subsequently did (in my defence). Looking at the HRV (with hindsight & the knowledge I now have from the Intervals advice my post has generated) I can see that my HRV did sound the alarm bell earlier than my RHR. I suspect that I dismissed that as my HRV data record was still building as I only started collecting it Feb. Again I know this might sound like an excuse!
In terms of intensity I can see that afterwards I was doing too much Z3 running still so the recovery period was no such thing really. But again that was me trusting the objective (RHR & Form %) which were good over subjective (feelings that my subconscious can sabotage) & compounded by not being confident in HRV.
As you can see from the last 3 months I was trying to achieve a cyclical pattern in terms of weekly loads. I do hold my hands up to the swimming being too consistently intense but (again in my defence) did reduce the run & ride intensity, at least in March. With hindsight I admit that the evidence indicates that increasing the run intensity at the same time as maintaining the swim intensity is perhaps the point of failure. The RHR did start to get erratic (due to the PVC rate (premature ventricular contractions - see my first post in this series) becoming regularly 1:1) two weeks after my run AND swim were both predominantly in Z3.
So I cannot deny that over training might be the cause & I do need to respect Z3 chronic fatigue risk more than I have been.
The exhaustion is likely pseudo-heart failure as my RHR is pretty much 30-31bpm & so cardiac output likely 60-70% of previous. I am a bit short of breath which could be that or a host of other reasons e.g. hayfever or Covid/Long Covid. But as you say the exact cause is perhaps moot to the reality significant rest is likely needed & then a radical change in my training methodology following your excellent example.
I do feel like a teenager getting their homework marked with all this in depth analysis of my graphs & excuses. But in fairness this perhaps does prove that experienced teacher-led school lessons work better than attempting “home schooling”! And as much as kids hate exams, the timing of them does help with a structure of gradual progression, intense learning/cramming, the event & then brain recovery afterwards for a while once they are done.
In terms of graphing your ride/activity times it should be straight forward by using the options in my example graph settings. That will then give you time in each.
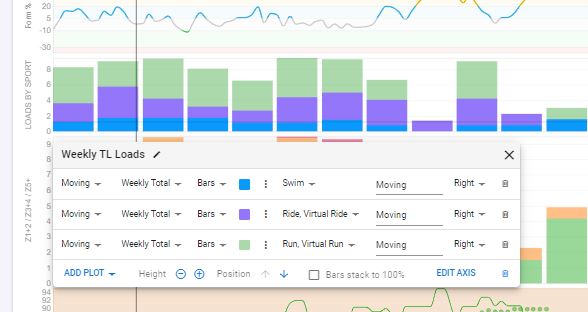
If you wanted proportion of time in each then you would tick the “Bars stack to 100%” tick box & the left hand scale becomes 0-100%.
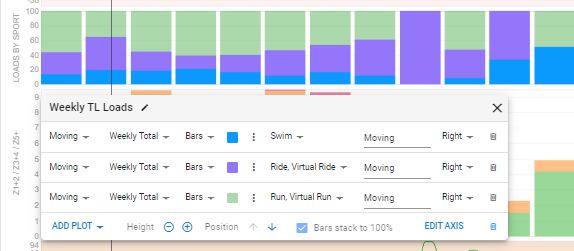
I presume that is the problem that you meant.
Many thanks once again.
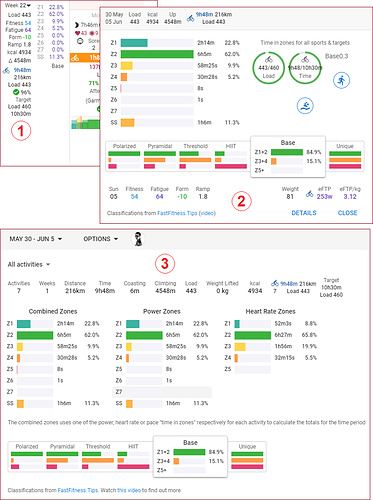



 )
)

