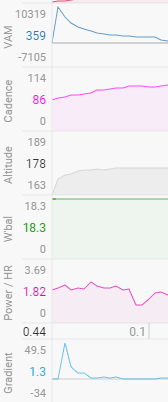
I always experience a spike in my Altitude / Gradient / VAM charts, at the very beginning of each activity.
I cannot fix that funny data, so it always shrink down tha values (Y-axis) scale and the graph is quite unreadable (almost flat).
Any idea of how can I fix that? Is it my Gramin or Strava privacy zones?
Do you have a unit with barometric sensor?
If so, you need to acclimate the unit for a few minutes before starting the recording. Turn on your unit a couple minutes before you get started to allow it to adapt to a stable temp.
My Garmin 830 has much less problems with this than my older Edge 705. Display height and wait for it to get to a stable value. Then start recording and you should be good.
Unfortunately the data is “real” in that its not null or something I could detect and skip over:
time
watts
cadence
heartrate
distance
altitude
0
185
59
91
5.0
163.8
1
199
63
93
10.3
170.6
2
219
65
94
15.6
172.4
Altitude isn’t an editable field currently and that would be a pain to do every time. I suggest try cropping it a little on Strava and in future try waiting a little bit for altitude to stabilise as @MedTechCD says.