@Luisma_Gallego_Soy_P is doing some cool work with the Garmin IQ Apha1HRV app combining Alpha1 and Respiration Rate. My question is: is it possible to create a custom chart on the activity page which has one metric divided by another i.e. RespRate/Alpha1? @david
5 Likes
Not yet. But I am am working on making Intervals.icu extensible like that.
5 Likes
- Explain the split metric search? Thanks
As per your Twitter posts I download the data from Intervals and put it into Google sheets to create the graph of RR/A1 against time on the ramp test. I was asking if that could be configured in Intervals to save time, as messing around graphing is quite time consuming.
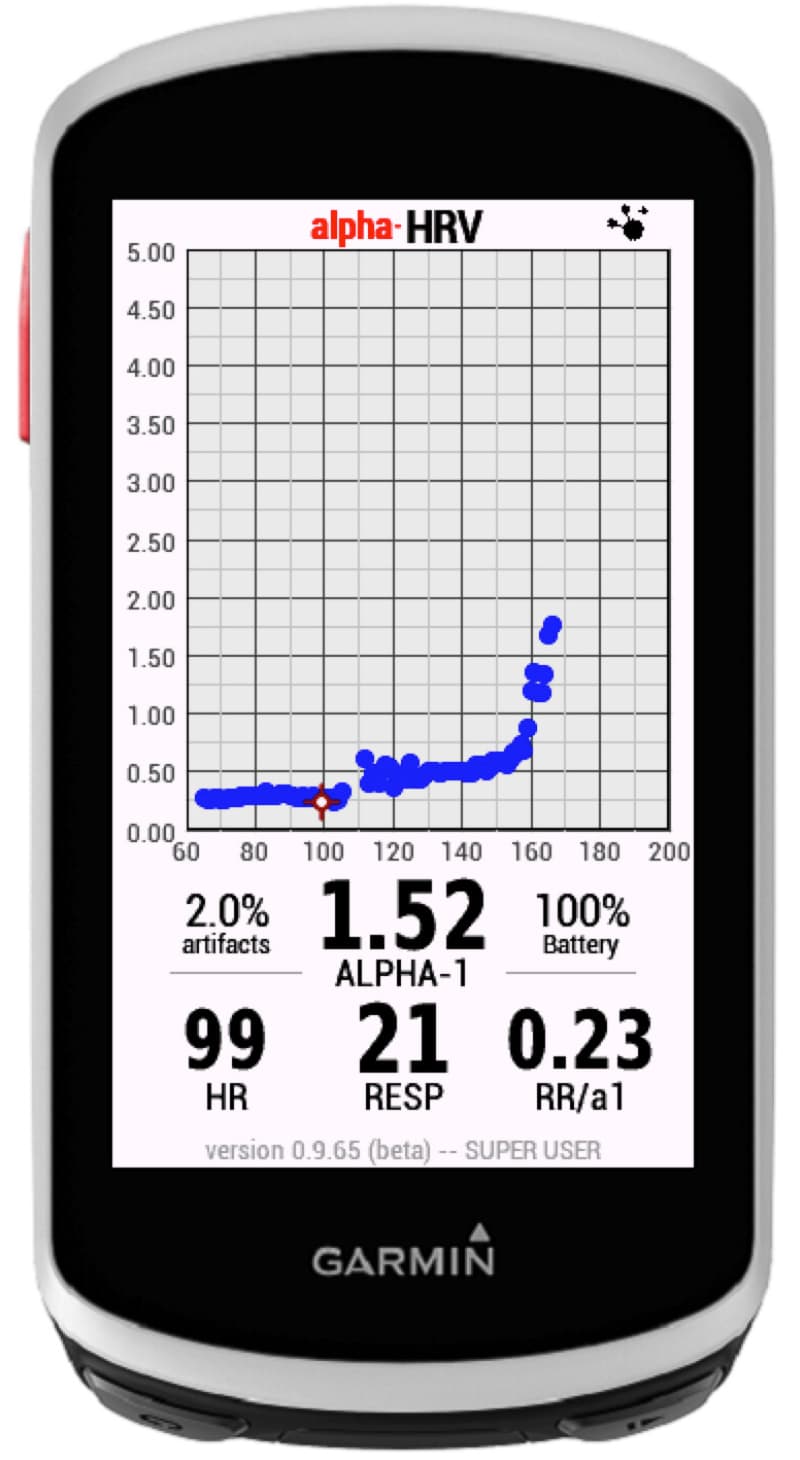
From your and Inigo’s Twitter posts, it looks like you are using breathing frequency (in Hz - so breaths per sec) divided by a1 to get a stronger indicator for the deflection point.
A typical stable state under AeT would return values in the order of 35 breaths per min and a1 around 1.5 resulting in a calculated value around 0.4.
For intensities well above AeT, 60 breaths/min and a1 at 0.5 resulting in 2.
That explains the vertical scaling in the screenshots. And since you have already seen multiple cases where the a1 and resprate deflection points occur at the same time, the combination of both will make it easier to pinpoint the AeT.
Love the work you’re putting in all this 
Exactly, both a1 and RespRate variations seem good indicators for AeT detection. But, each parameter alone can be affected by “noise” that makes difficult to use it in a simple way for that purpose.
Combining both as FR/A1 provides a strong indicator where responsiveness of each one is potentiated. Even, in case that one fails, the other one can provide enough information.
Moreover, AeT detection is being based on slope variations instead of absolute thresholds. That makes the procedure stronger and less dependent on specific values that could vary for different athletes. Slope variation seems to be a general “behaviour”.
Right now, location of the slope variation point is detected by means of a bilinear fitting process, where both lines are automatically optimized, without any necessity of manually defining range convered by each line.
Using Heart rate instead of time for X axis has also shown better results as it makes more clear any trend.
Results are promising.
4 Likes
It’s almost as if, when intensity increases Respiration rate increases and A1 decreases and the result of dividing one by the other amplifies the data making the point of inflection much easier to see.
That’s the point
2 Likes
Working on extracting information from [RespRate / alpha1] ratio.
alphaHRV will show soon live [RespRate / alpha1] chart.
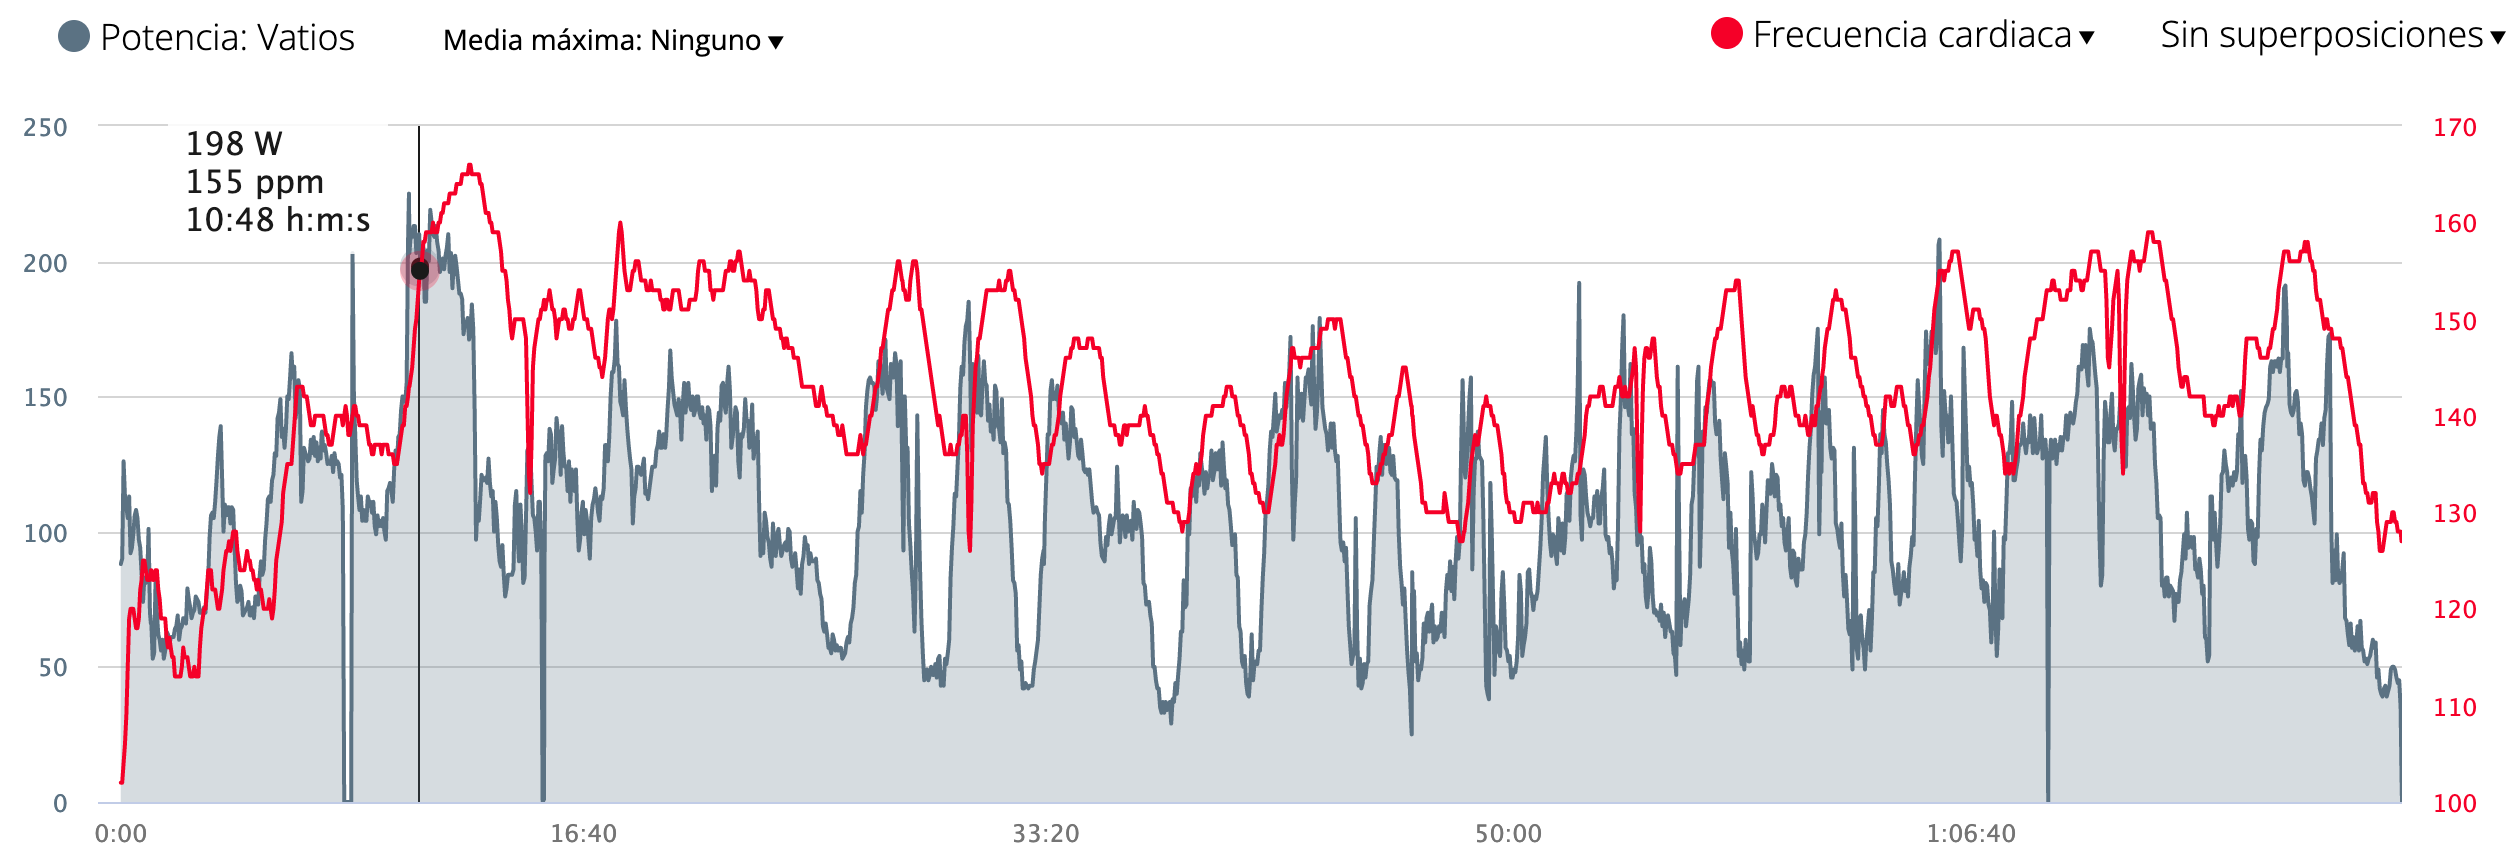
Even for non structured activities it seems that there is some hidden pattern.
See chart shown during a low intensity (with a short effort at the beginning) free ride in Hawaii (virtual unfortunatelly  )
)
2 Likes
We are doing the tests together with @Inigo_Tolosa , testing with lactate and VTs, there is a very good correlation in the rr/a1 trend changes in first threshold, in second threshold we haven’t started the tests yet, but we think that there can also be a very good correlation. At the same time we are studying the validity of a new internal load metric based on rr/a1. A1 has an effect on RR, but it is fully usable, RR is not so much affected by heartrate. Unfortunately we can’t post on twitter (criticism from other coaches) so we will use the intervals forum if @david allows it to show you our progress. At the moment both Thomas Gronwald and Bruce Rogers are knowledgeable about all the research and we will certainly have their help.
4 Likes
You shouldn’t shy away from posting your research, findings and hard work due to fear of criticism - I appreciate that is it tough if it is not constructive, but without a wider field of research and opinions to challenge it we do not learn together.
That being said I am sure you will be supported here and I certainly look forward to hearing more.
2 Likes
Please continue posting here. Hopefully I can add some new stuff to the activity HR page soon!
4 Likes
Please continue to post on here. I personally think it’s fascinating what you doing in this area. Many coaches seem use Twitter as a marketing platform and are only really interested in pushing their own methodology and aren’t interested in any new ideas.
2 Likes
Hi @david ,
Did you ever add the “new stuff” to the HR page that would support extracting LT1. I’ve trying to find it but to me it doesn’t seem to be there?
By the way, thanks for all the wonderful work you’ve done for this community!!!
Best regards
Stig
Tx. Unfortunately I ended up getting pulled in a lot of different directions and haven’t got to that yet. @Inigo_Tolosa has created some custom activity charts that might help you. Click “Charts” at the bottom of the activity detail pages and search:
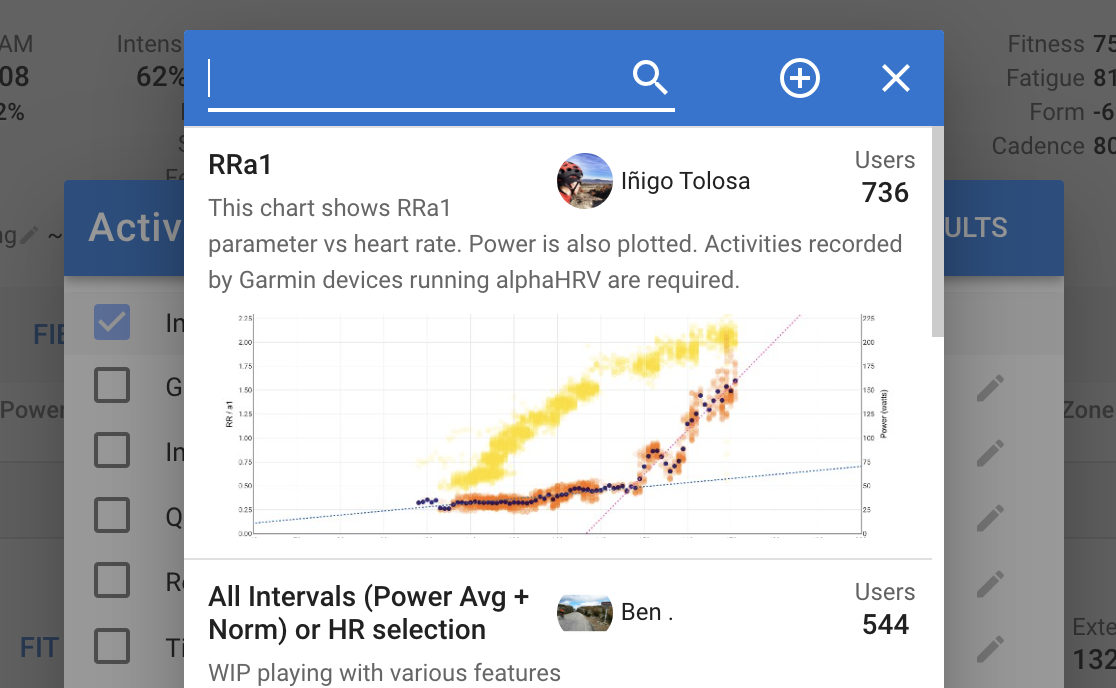
1 Like