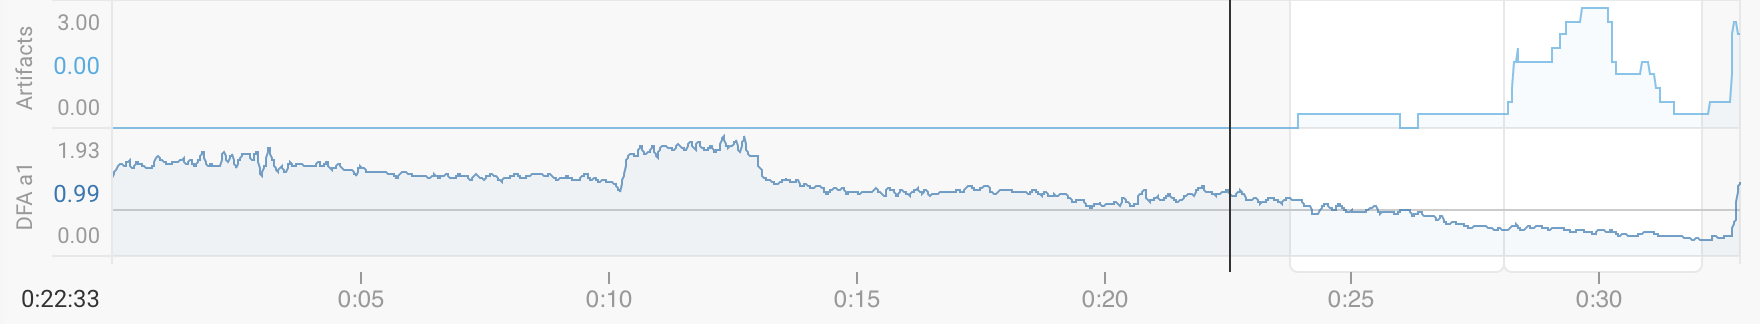
Is it possible to give us the option to add a plot for the “Artifacts” HRV Alpha IQ App from Garmin Files in a custom activity chart?
For me is important to check how “noisy” or reliable is the data captured from the HRV sensor during whole workout in the same page we have Alpha and RR charts… (activity)
I hope, it should not be too much work as it comes with Alpha and RR from the same IQ app in the fit file, it’s name is “Artifacts”.
Thats great. On a slightly different note could anyone write a script for plotting RR/a1 on the custom activity page either as second by second or by interval? I would but I haven’t a clue about coding. ( The last time I did any programming was in Basic or maybe Fortran some 50 years ago on computer the size of a office block)