Actually, when I think a bit further on it, there may already be possibilities to experiment with an alternative way of calculating TSS.
You do have access to all individual streams and can do your own calculations on them in a Custom activity field with JavaScript. But I don’t have enough knowledge to tell you if and how you can use Integrals and other advanced math in JS.
It doesn’t count pause times to the TSS calculation. So in your example, if you would be driven home, it would end up in a similar TSS.
If you go downhill you don’t need another 10m, maybe 1m. so your TSS won’t be so high as in your first post.
Just try it. So, in reality that is not a real problem, more a problem ‚on paper‘.
The formula is not perfect, but there is no better. What would be your better Load calculation?
TSS = (sec x NP® x IF®)/(FTP x 3600) x 100
…where
- “sec” is duration of the workout in seconds,
- “NP” is Normalized Power® (don’t worry about this for now),
- “IF” is Intensity Factor® (a percentage of your FTP; in other words how intense the effort was),
- “FTP” is Functional Threshold Power (your best average power for a one-hour race or test),
- and “3600” is the number of seconds in an hour.
Freewheeling at 0W is just an extreme example to show the formula is wrong.
Low level efforts got a bonus from being in the same workout as high level efforts as well which causes long rides to have inflated TSS.
If you go downhill you don’t need another 10m, maybe 1m. so your TSS won’t be so high as in your first post.
Just try it. So, in reality that is not a real problem, more a problem ‚on paper‘.
It doesn’t take a minute to ride down from the hill you need 10m to climb either. Just today I’ve done a climb and then rode it down at the end of the workout. It took me 52m to go up and 18 minutes to go down even though I wasn’t actually freewheeling and got a very good downhill time (in the top 10% overall on a segment world tour pros use all the time on their camps on Tenerife). Freewheeling it would take 24 minutes or so (I know because I was riding it with a friend who doesn’t usually ride in the mountains). KOMs are: downhill 14:14, uphill 30:18, again set by World Tour pros.
The formula is not perfect, but there is no better. What would be your better Load calculation?
Let me repeat a better formula:
[EDITED after @R2Tom pointed my mistake]
1)Calculate rolling 30 seconds average function of power expressed as % of FTP just as in TSS
2)Square it
3)Calculate area under it
4)multiply by 100 to get TSS scale
You end up with the same TSS function but without artificially inflating zero/low efforts in workouts with some intensity in it.
The problem is that TSS increases linearly with time but NP squared (what you end up with from NP * IF) doesn’t linearly decrease. This means that inserting near zero/low efforts into the workout inflates their value. It’s not a problem only on paper either. Just today I’ve done 3x15 sub threshold intervals on otherwise quite spirited ride and got the same TSS score I’ve got on lazy ride 2 days ago just because that lazy ride was an hour longer, mainly because downhills on it were very technical and I needed to use breaks a lot while today I was descending at decent speed on good roads.
Another way would be to just slice the ride into many pieces, calculate TSS for all of them and then sum them up. It’s just integrating though so one can do that instead as it’s simpler to implement and more precise.
Let me bring your attention to this again:
Actually Intervals.icu does leave the pause out of the TSS calculation, it does that even if you don’t pause otherwise rides with punctures and coffee stops get inflated TSS. TSS of 151 for 4h30 doesn’t seem high. The time in zones info is incorrect. Intervals.icu uses “moving” to decide what to include there and this ride has no velocity or moving streams. I should be able to fix this because there is no data for that 90 min part.
Clearly the problem is obvious enough but deciding what to include based 0 efforts is just a very small part of it. Just to point to an obvious example: if it’s 1W-10W instead of a 0 it will not change anything and depending on the terrain you ride in you can get a lot of 1-10W time. That wouldn’t be a problem if you are in the mountains all the time but then you come back home and wonder why it’s so difficult to keep your fitness score high and end up overreaching/overtraining. Just take integral over a squared function, calclate square root of that and then everything makes sense (or at least allow users to use that function instead of original TSS). The math and the algorithm also becomes way easier and not arbitrary. No reason to decide what is and what isn’t a real pause either.
Again, it doesn’t alter underlying physiological assumptions. 2hours at 70% of FTP still results in the same score as 1hour at 100% of FTP. I am not here to discuss if it’s ideal or not. I don’t want to question underlying physiology or assumptions. I am here to correct the math side of it as it’s a clear problem with an elegant solution.
That might overestimate short rides, but I fully understand your intention. Personally, I don’t focus as much on that specific value, but rather for example on increasing work on a weekly basis.
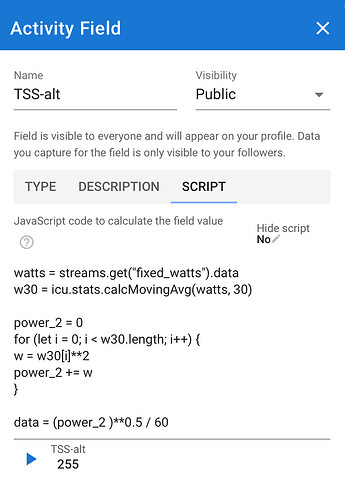
But you can use your own custom script - I have tried to create your calculation, feel free to adapt it to your wishes
Create your custom fitness chart
It will actually value short rides more (as standard TSS overestimate long rides with some but not much intensity in them).
But you can use your own custom script - I have tried to create your calculation, feel free to adapt it to your wishes
Wow, this is awesome! Are those available in “custom activity streams” or somewhere else? If I can use custom functions for my own fitness chart that would solve my issue in a better way than I ever expected.
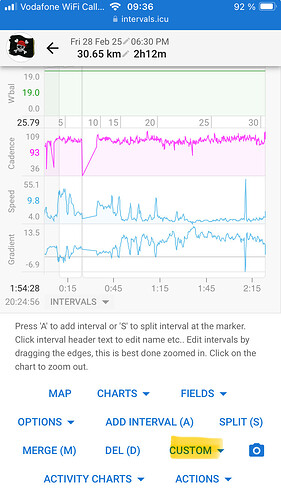
You find this in ‚custom‘
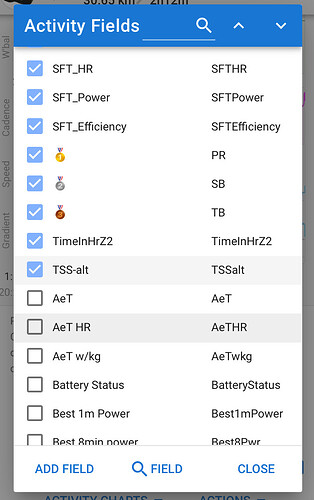
Click on Add Field to create your own Script (or search for TSS-alt as an example script as mentioned above )
You can then write your own js to create the value of your choice.
There is a big thread with information what data is available.
It’s the other way around. TSS in the last few hours of a long activity is the same as the value in the first few hours, despite the added fatigue as the duration increases. So it under values the stress from long durations.
Normalised power already raises the 30s average power to the 4th square, to weight more intensive efforts. Then intensity is squared to give the resulting load (TSS), resulting in higher weighting for harder efforts.
It will actually value short rides more (as standard TSS overestimate long rides with some but not much intensity in them).
I‘ve tried your formula with some example rides (in brackets ‚original‘ TSS):
10 hour Ride was Load 500 (500)
2 hour Ride was Load 250 (90)
15m commute was Load 90 (13)
So, I will stick with TSS, because longer rides will reflect it better due to greater fatigue, as @Gerald mentioned. However, as stated above, if your formula works better for you because you do more short rides, you can create your own fitness chart and load calculation.
It’s the other way around. TSS in the last few hours of a long activity is the same as the value in the first few hours, despite the added fatigue as the duration increases. So it under values the stress from long durations.
Yes, original TSS doesn’t account for fatigue already acquired. Neither does my formula. My formula doesn’t fix this particular problem, it fixes others though.
I‘ve tried your formula with some example rides (in brackets ‚original‘ TSS):
10 hour Ride was Load 500 (500)
2 hour Ride was Load 250 (90)
15m commute was Load 90 (13)
I am sorry but it looks like you are misinterpreting my formula. My formula gives the same results for rides with the same power. Specifically 2 hour ride will have 5x smaller area under the curve as 10 hour ride at the same power (obviously?). It looks like you are doing something very wrong.
Can you describe the rides you calculated (power, duration) so I can verify those?
Area under the curve depends on duration (obviously). The differences appear in rides with mixed intensities. My formula is akin to splitting the ride to multiple parts and calculating TSS for every one of them.
I am sorry but it looks like you are misinterpreting my formula. My formula gives the same results for rides with the same power. Specifically 2 hour ride will have 5x smaller area under the curve as 10 hour ride at the same power (obviously?). It looks like you are doing something very wrong.
Let’s take an example.
- Constant 200w for 2h
sqrt((200w)² * 7200s) / 60 = 282
- Constant 200w for 10h
sqrt((200w)² * 36000s) / 60 = 632
- Constant 200w for 15m
sqrt((200w)² * 36000s) / 60 = 100
I took this formula:
1)Calculate rolling 30 seconds average function just as in TSS
2)Square it
3)Calculate area under it
4)take square root of it
- the rolling average will be constant 200w
- sqaure it will be 40000w²
- for constant value that will be: result from 2 times duration
- square root it
That is what you’ve said, and what I’ve calculated.
I’ve added the /60 to get smaller values, but that’s just a linear factor.
Another problem is, that it doesn’t consider relation to FTP (intensity).
Right, thank you. I was overexcited and made a mistake when copy-pasting the steps.
Area below squared power curve doesn’t require square root at the end. Just express power as % of FTP and take the area below.
In your examples assuming 200W is 71% of FTP (to produce 0.5 IF) the area below squared curve is:
1)For 10 hours 0.71**2 * duration = 0.5*10 = 5
2)For 2 hours it’s 1
3)For 15minutes it’s 0.125
To get TSS scale you need to multiply the results by 100.
I am sorry for the confusion, square root was artifact of my notes and I haven’t checked carefully enough. It should be “multiply the result by 100” instead.
The idea is that this way the result is the same for every interval with monotonous power and the score for the whole ride is the sum of those intervals (+/- depending if we apply 30 seconds smoothing or not). This is in the spirit of original TSS idea but solves the problem of rest/very easy periods increasing the total score.
Original TSS gives a lower score for uninterrupted interval than two intervals half as short with rest between This is clearly nonsense. We can eliminate this nonsense and keep the rest.
Sure, it would be very nice to also have a function that scores 20m work - 20m easy higher than 10m work - 10min easy - 10min work - 10min easy but this requires a different kind of function (similar to CTL but operating on seconds not days) and it’s a research project to develop it. Original TSS can’t do it either - it’s not aware of order of intense segments. I am just trying to solve the most glaring issue. My formula is equivalent of stopping and restarting your bike computer multiple times during the ride and summing up the resulting TSS of those shorter parts.
Anyway, it looks like I can program and fix it myself so I will go do that and come back if I encounter any issues. Thank you for linking me to the resources, it’s very helpful and looks like exactly the functionality I am after!
Thanks for clarification, that would indeed makes a lot of more sense.
Will eventually try it myself, could help to not count coasting time. ![]()
You can actually update the default activity training load from a custom activity field script. Return your custom value but also update the value on the activity:
activity.icu_training_load = ...
Then your custom calc will automatically show up on all the usual charts.
Ah nice, didn’t know that. ![]()
Does this works for every data field that is editable?
Yes. Everything that is computed during analysis which is most things. The analysis is done first, then the custom fields, then the db is updated.
Thank you! It’s awesome it’s designed this way.
I still think TSS is based on a simple math mistake, it should be duration * NP and NP should be average of squared values expressed as % of FTP.
I kinda given up convincing people and started enjoying their mental gymnastics around why TSS kinda works but not quite or why it’s fine to remove 0s at the end but not in the middle of the workout (TSS function is not order aware so it’s just silly exercise). I am very happy you designed the software in the way to let users insert custom values. I am a subscriber and will soon be double subscriber (for my girlfriend as well) and couldn’t be happier with what we are getting here.
I kinda given up convincing people
You don’t have to convince us, most of the advanced users already know that.
But I assure you that as soon as you introduce a different way of calculating TSS as a default one, the forum will be flooded with ‘Bug Reports’. Simply because it deviates from the big players (TP, WKO, Strava…) who are ‘considered’ the only source of truth. It off course has to do with the fact that elite’s have been using this for decades.
There’s an easier way of training, where TSS isn’t the driving metric, but rather duration, frequency and/or intensity drives your way forward.
- Workout a little longer than before (duration)
- Workout more frequently than before (frequency)
- Workout a little harder than before (intensity)
- Recover a little less between efforts
- Recover after 2-3-4 weeks of progressive increases in volume/frequency/intensity
The only thing I would change is the order of the first two. Apart from that, I fully agree ![]()
Fair enough.
And here I though listing it in alphabetical order, would keep it neutral ![]()
- Duration
- Frequency
- Intensity
- Recovery


