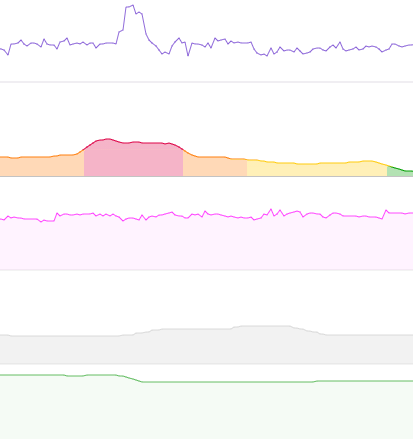
I think this would be easier to interpret, mostly because I can’t make the 30s pow chart taller. Dunno, maybe you’ve already tried and it didn’t work. But if it’s a simple change, please consider it.
Something like this:
I think this would be easier to interpret, mostly because I can’t make the 30s pow chart taller. Dunno, maybe you’ve already tried and it didn’t work. But if it’s a simple change, please consider it.
Something like this:
I have added that to the todo list. If you click “Options” at the bottom of that page you can choose “Taller charts” to make them all 50% taller.
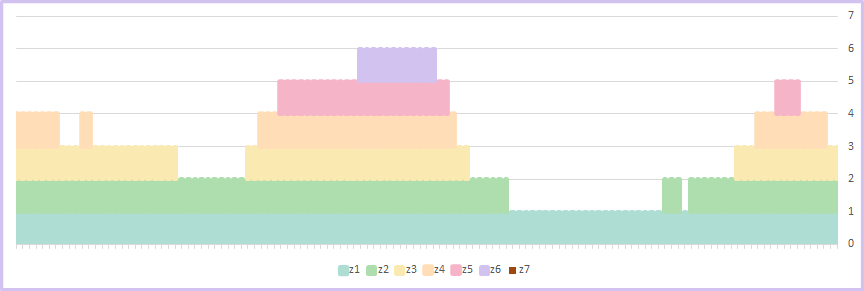
Another variation, possibly appropriate for a new, separate chart option: The 30s ave chart with power rounded to zone and the zone layers have equal height
So each zone layer would be 1/7 of the available height?
Yeah, I guess if there was no data in the higher zones then layers could be more than 1/7. Something like this… Without the lower zones shaded would look better maybe, but then it’s just a fat line.
Anyway, the objective is to be able to look at intervals and quickly see how good compliance was (ie. sticking to single zone). Perhaps that could be achieved with adjustments to the 30s ave chart and a zoom to interval option.
I have added that to the todo list. It’s easier than making the zone colours vertical!