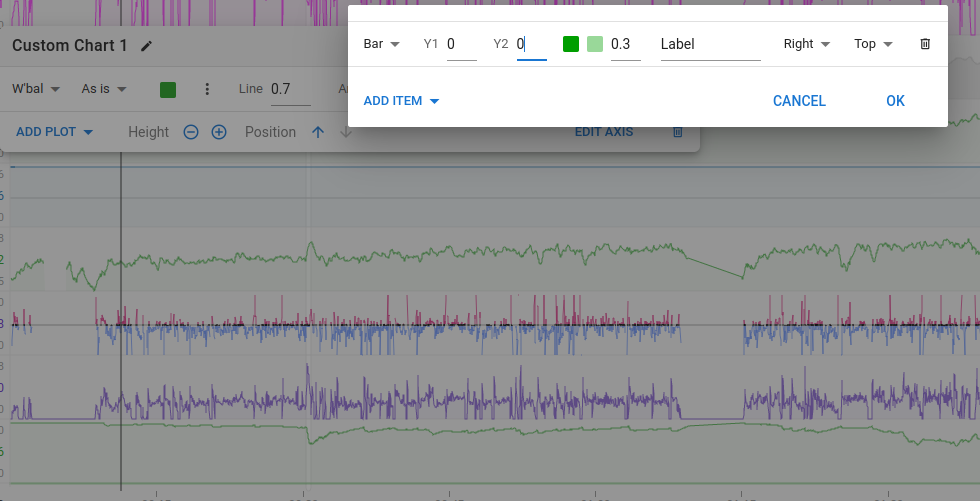
You can add your own chart for W’ and by clicking on the three dots add a bar with both Y1 and Y2 values set to 0.