Hello,
I am monitoring the trainings I am performing based on Polarization Index, and I find this tooltip very useful at activity level:
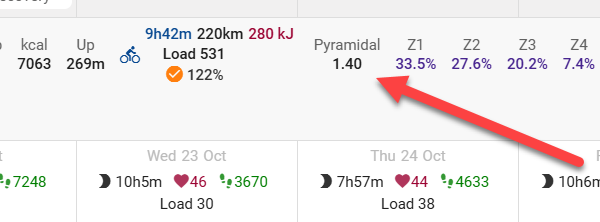
The same information is available in “Activities”, in the weekly summary header:

I am trying to get this type of information to be displayed on the weekly “Fitness” graphs. The only parameter related to this info is the “PI” (Polarization Index), but I don’t find the type attached to it (Base, threshold, Pyramidal…).
Would it be possible to add this “Training Polarization” as a chart that can be plotted on a weekly basis (same values as the one exposed in “Activities”). “Training Polarization” could returns on the Y-axis the Unique/Base/HIIT/Threshold/Pyramidal/Polarized info, based on the computed PI?
Thanks!
X.
