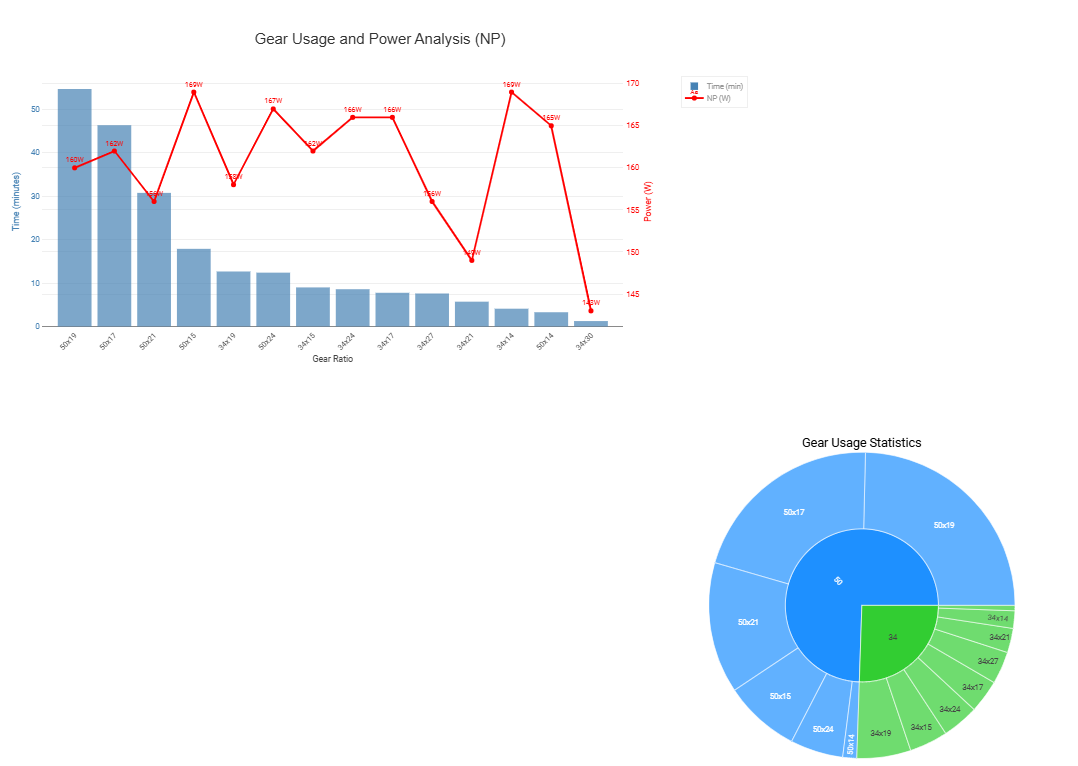
To analyze the relevance of development choices, it would be great to have the option to overlay a curve on the route showing the gear ratios, along with a table summarizing the usage of each gear ratio. For Shimano groups, this data is available in the .fit file because the bike computer can display the gear ratio in real-time, and it’s possible to extract this data using apps like GoldenCheetah.
You need to add the custom streams for front and rear gear first, then re-analyze the activity (or record a new activity). Only then will the charts produce data.