I noticed that “fitness” is not one the plot’s that can be added to a Custom Chart.
I know that Fitness is already in the default chart, but I would like it have in the same chart with some other configurable plots for better visual comparison.
Thanks and also thanks for this great product!
Gr Johan B
2 Likes
That’s a good shout.
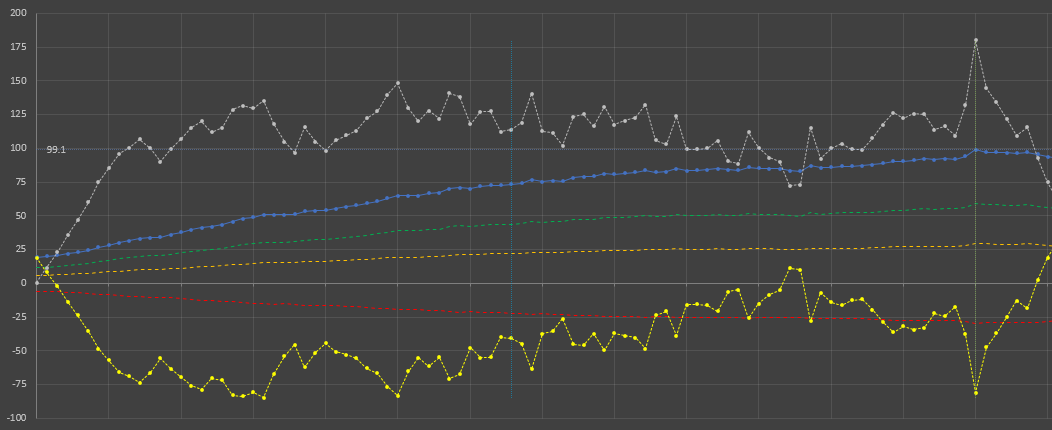
On a related note, I’d like to be able to plot Fitness, Fatigue and Form on the same graph and the same Y-axis so that it looks like this:
The green, amber and red lines are +60%, +30% and -30% of Fitness. This allows you to see both the absolute Form as well as the relative Form with a single line.
Would it also be possible to have an option for straight lines between points rather than the smoothing - it makes the graphs much easier to read in my opinion.
Mike
Fitness is available for custom charts - select load, and fitness average (42 days). You can even rename it fitness if you wish.
I overlooked that one.
Thanks for pointing out!
Well, there are a lot more options in the custom charts since I set mine up a few months ago. Time to get back in there and play around.
Mike