I couldn’t find a way to do this already, but I’d love to be able to add a column or filter in the Activities list view for various power curve durations. Example: I just raced and intervals told me I set an all-time 3m power record. I’d love to be able to see the 3m power in the list view for all other activities at the same time so I could compare. Having that available for different durations on the power curve (or configurable by the user) would be a great resource for identifying things that might affect improved or reduced performance, especially non-training related effects (e.g. stress at work, bad sleep periods, new diets, etc). It could also show improvements over time when training for specific durations (e.g. track cyclists training for shorter events vs gravel riders training for multi-hour events).
That can be achieved by creating a custom activity field; You can then view it as a column in the Activities list page, use it as a filter, create a chart with it, etc.
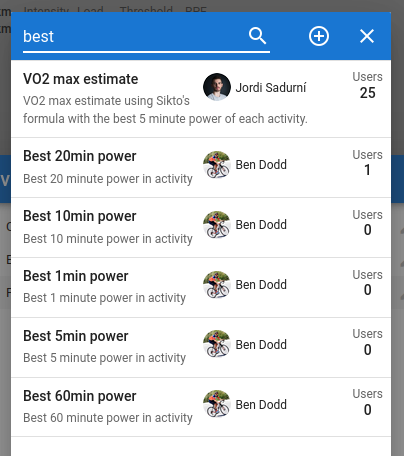
It appears someone has already created a couple, so you could start with that:

1 Like
Thank you for this! I was able to create my own 3min power field with the JavaScript code I found in those fields. I was hoping to be able to achieve this without manually editing every activity I’d want to include, though. Maybe I can make bulk edits to multiple activities via the API?
Edit: don’t need the API - once a custom field is added, reanalyzing bulk activities makes the custom field show up on past activities!
3 Likes