Hi
I’m a new user since a few weeks and i really like this app because it merge calendar, workout builder and analyse that i find in four apps at this time
The interface is great and i have uploaded my data from garmin and strava without any pb
I have 2 issues
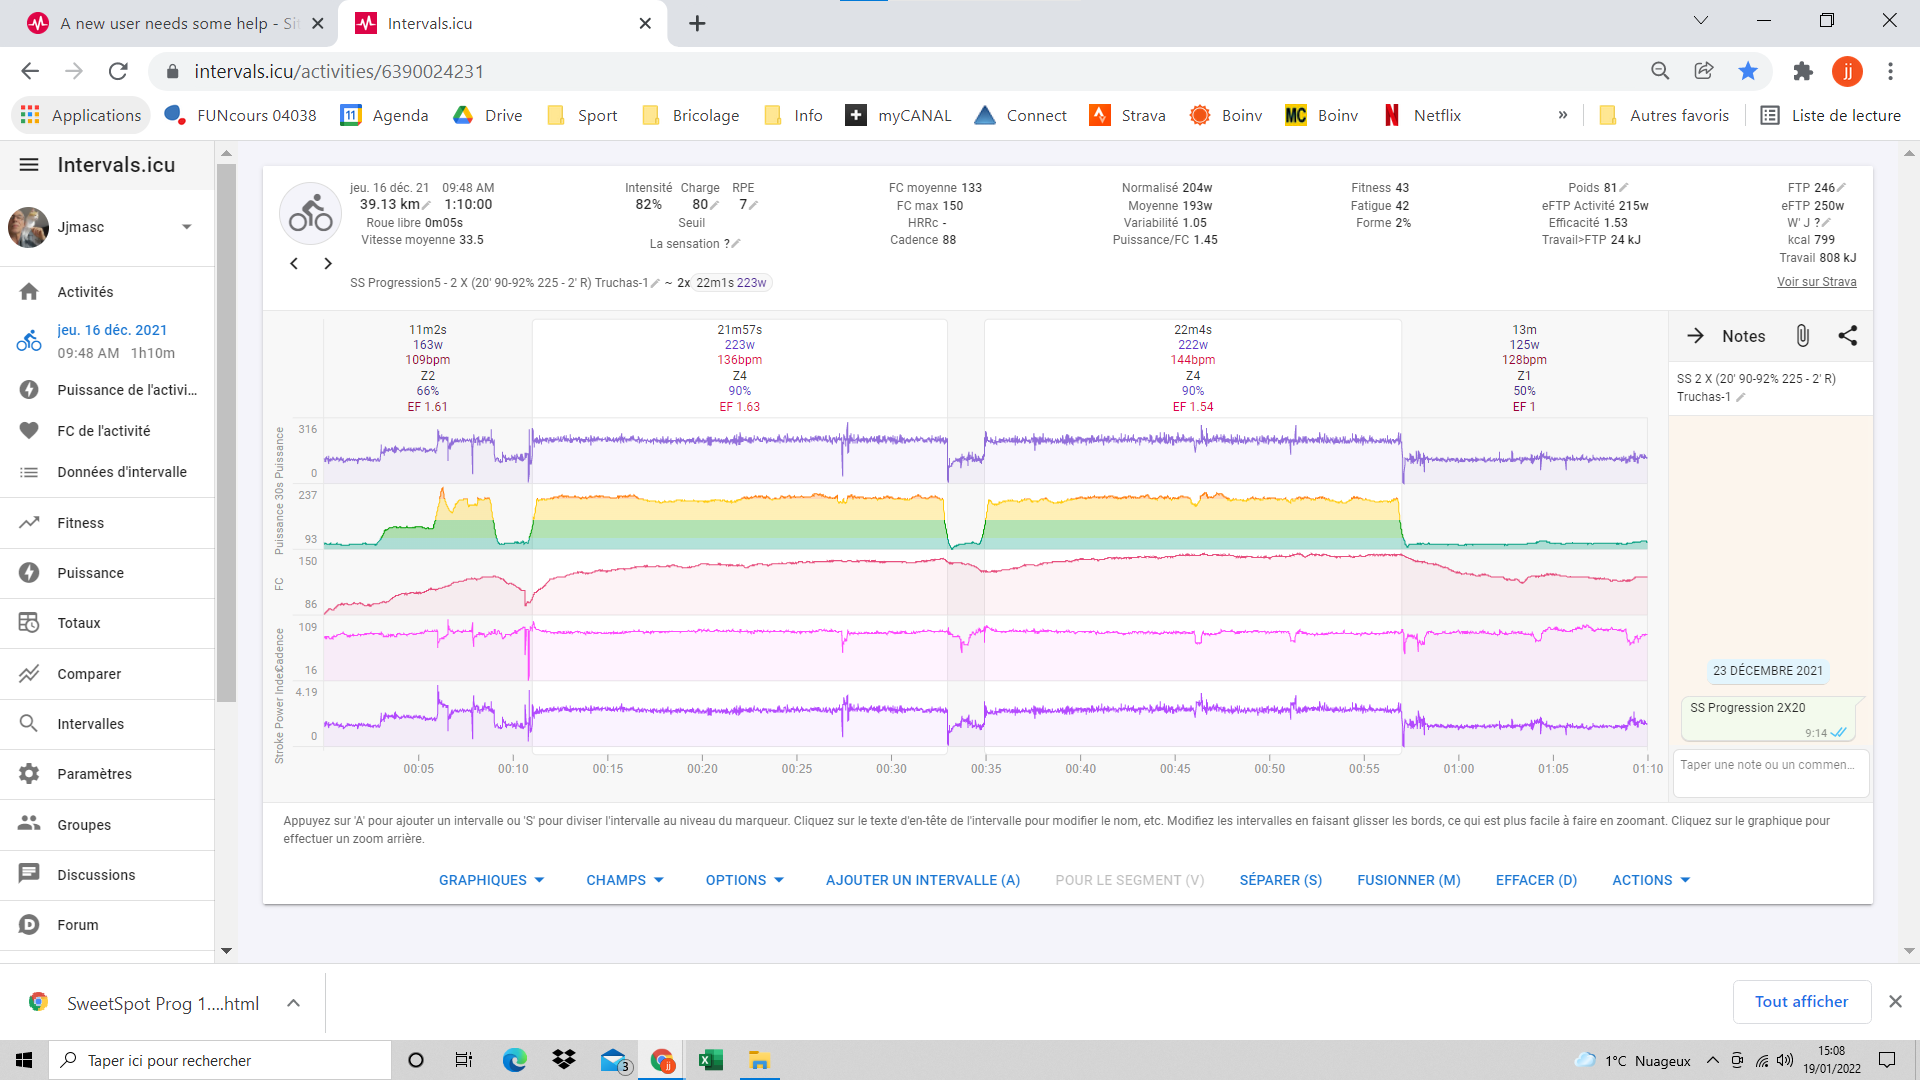
When i log , the first page displays the Dec 16 activity!! . Is there any way to display the activity of the day or the calendar page ?
I am surprised by the PDC curve which is less sigmoidal than in other apps. And it gives me very optimistic values for power at long duration . For exemple my best 4h Power is 164 W (season July21-April22) , the model gives 241W and eFTP=248W. CP is quite similar (232W) in GC but power at 3h is 167W. Do i need to do some test ? At what duration?
Do you have the 4h data in your Intervals.ICU activity database? You can try defining the curve with your own datapoints.
As for the model, I thought David was employing the Morton 3 parameter model. Another program could use a different model. CP and W’ are subject to the model being used. Its better not to rely on one model but use different models to get a range of estimations and take it from there. Critical Power is a bandwidth, not one value. I think most people overlook that fact.
Yes i have several rides longer than 4 hours and the curve of this period (July 21 - Now) shows the decreasing and is really lower than the model
I’ve tried to define a curve and got results worst than the model : the curve was a broken line with 2 points
OK with you about models, just want to understand if i missed something
Thanks
You mean “progression” in the name of the activity?
Does it matter in the description ?
When downloading from Strava do you download title and description, or title and notes for GConnect ?
May i suggest “Normal” instead of “Normalisé” in the scale of Sensation.
“Normalisé” is ok for “Normalized” Power
If you need , i can give a hand to review or participate in translation English - French
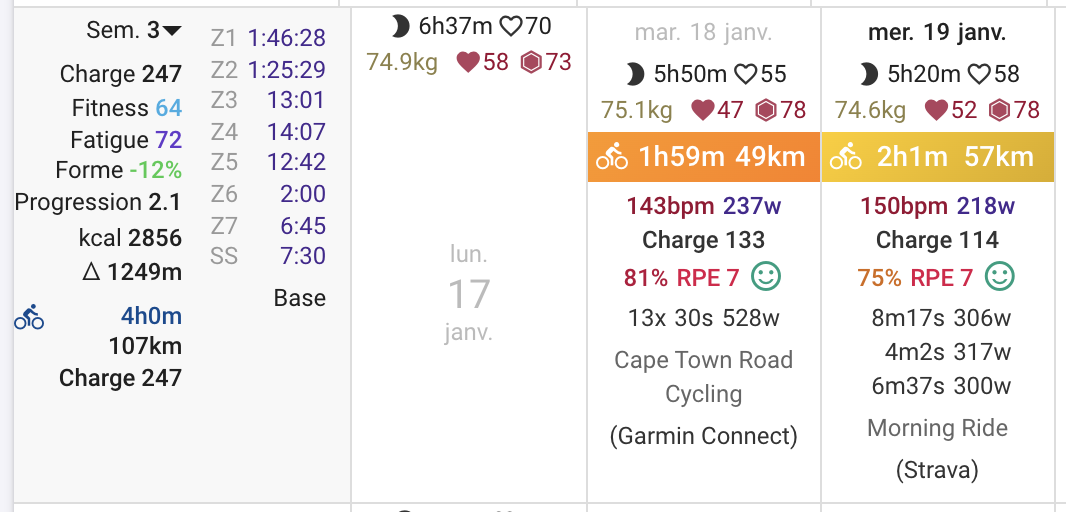
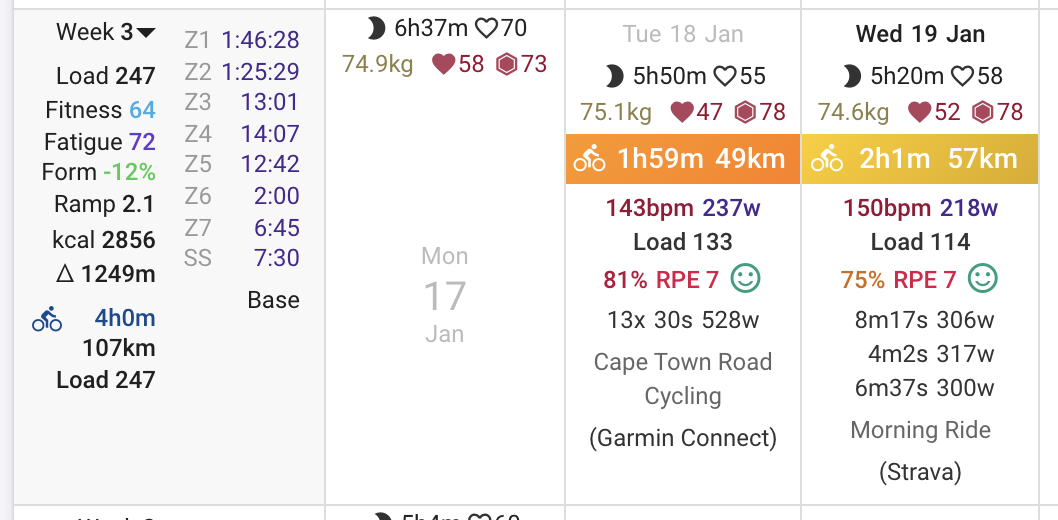
I meant “Progression” on the left hand side of the calendar where it displays “Ramp” in English for ramp rate. Progression doesn’t quiet fit and doesn’t look good.
ahh
I think it’s a field from trainer road , the progression of “Personnal Level” when achieving a workout . each worklout is given a level according is intensity zone
And it’s not appropriate in the week pane info because it’s specific to each zone (endurance, tempo, sweetspot …)
I don’t find where to change this : it’s not displayed on the activity screen
I don’t find it on strava or garmin connect
May be i’ve misunderstood the nature of this field because my last workout has a progression of 0,3 !!!
If it is the “ramp rate” according to PMC Model , there is no need of translation : “RR” is the term we use
but the value is 0.3 in the Calendar page, and 3 in the Fitness Page
Edit
I think i found the difference :
calendar page displays the values of the last day of the week according to training prevision, title of the popup : “taux de progression”
Fitness page : the values of the current day, title of the popup “Taux de progression hebdomadaire”
May be the 2 titles could be updated
Edit2
I just see the date of the day at the top right of the fitness page.
There are so much information in your app! i need to use it a lot before making any suggestion