private messaged the signup link. I can share it publicly if others want it.
yes please do

This is seriously great work thanks!
1 Like
Hi a bug report (?)
The cadence shown in the new activities screen differs from what intervals.icu site is displaying. By a decent amount not just 1rpm like as if it were a rounding difference.
Yup, you’re right, good catch. I was testing with some zwift rides and my numbers were close enough to be a rounding difference, but outdoor rides with a lot more coasting are way off (I think that’s it anyway). I shouldn’t be trying to calculate the average based on the stream of time series data, and should just grab the pre-computed number. I was taking a bit of a shortcut by treating all the time series data for the new graphs pretty generically. I’ll need to refactor that a bit but it should come out better.
I am running the beta app 1.4, how do I access the nice heart rate zone distribution bars?
Thank you! Looking forward to the update.
It looks like I had a bug that was causing the HR zone distribution bars to only show if you also had power data. This is fixed in 1.4 build 5 which should show up in TestFlight shortly.
Version 1.4 build 5 is great and now I see the HR zone distribution. Some feedback:
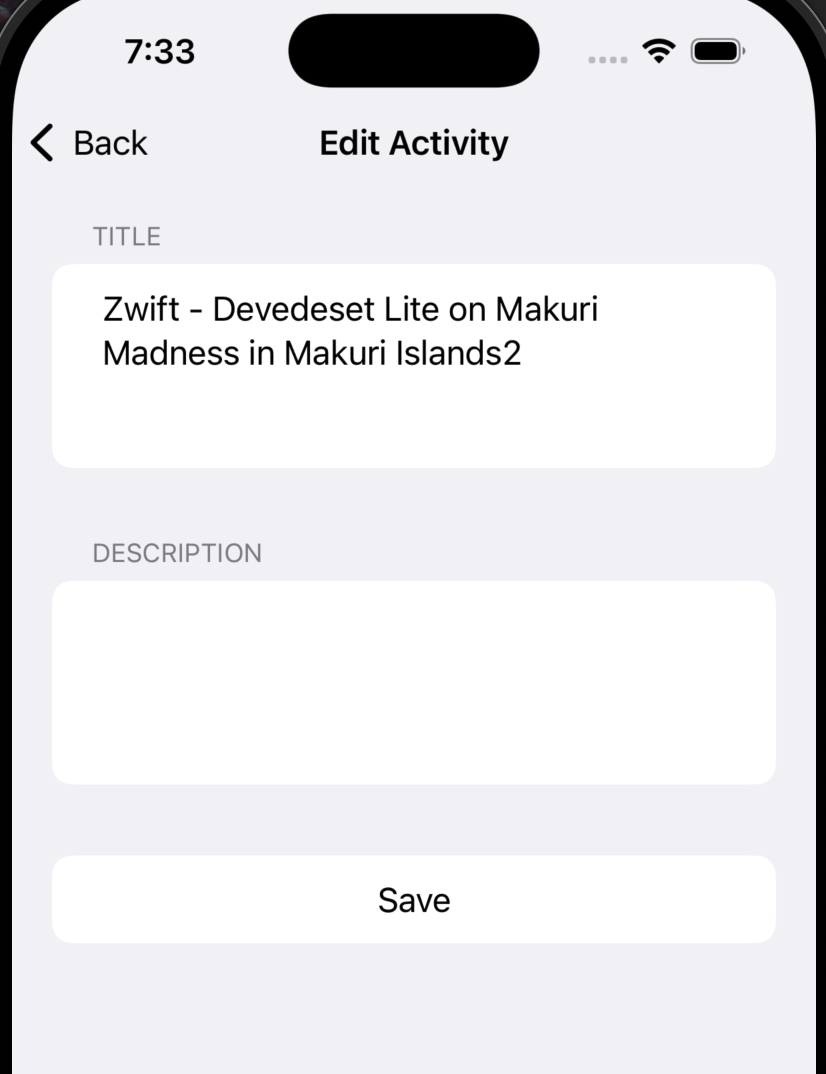
- editing a workout isn’t yet working, I can enter the data then hit save, and it jumps back to the workout, going back to edit mode all previous entries are gone
- maybe the save button when editing an entry could be better highlighted, looks the same as the input fields
- where can I see the map on a workout?
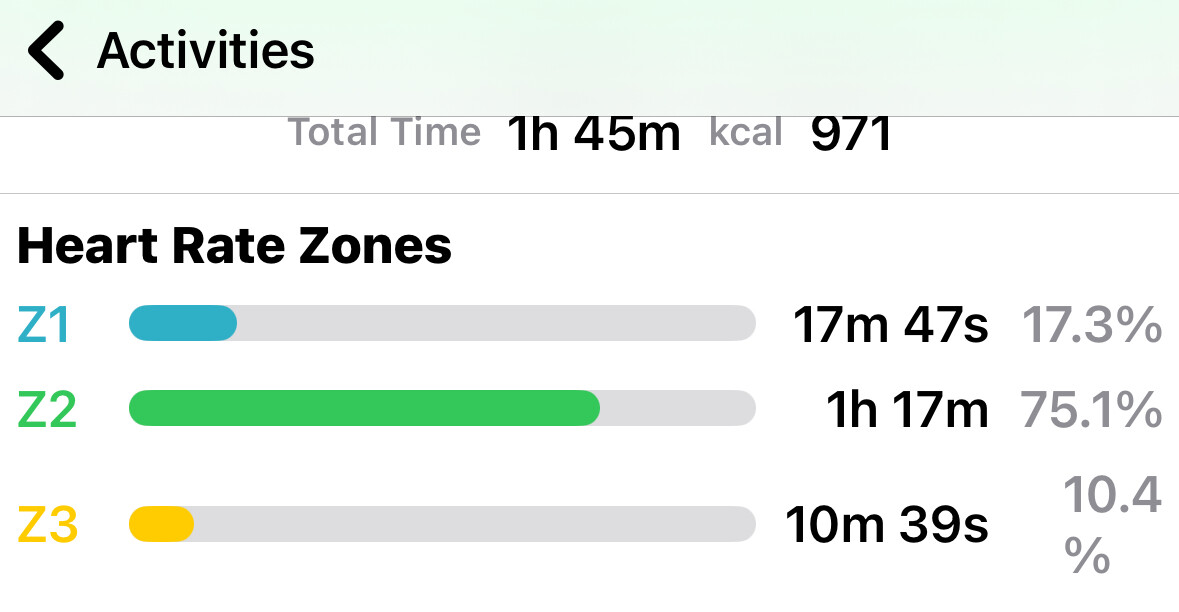
- HR zone view has a warp issue for the percentage
Did you logout of the app and back in again? You need to sign in again and grant write access to activities, as that scope wasn’t part of the prior oauth login flow.
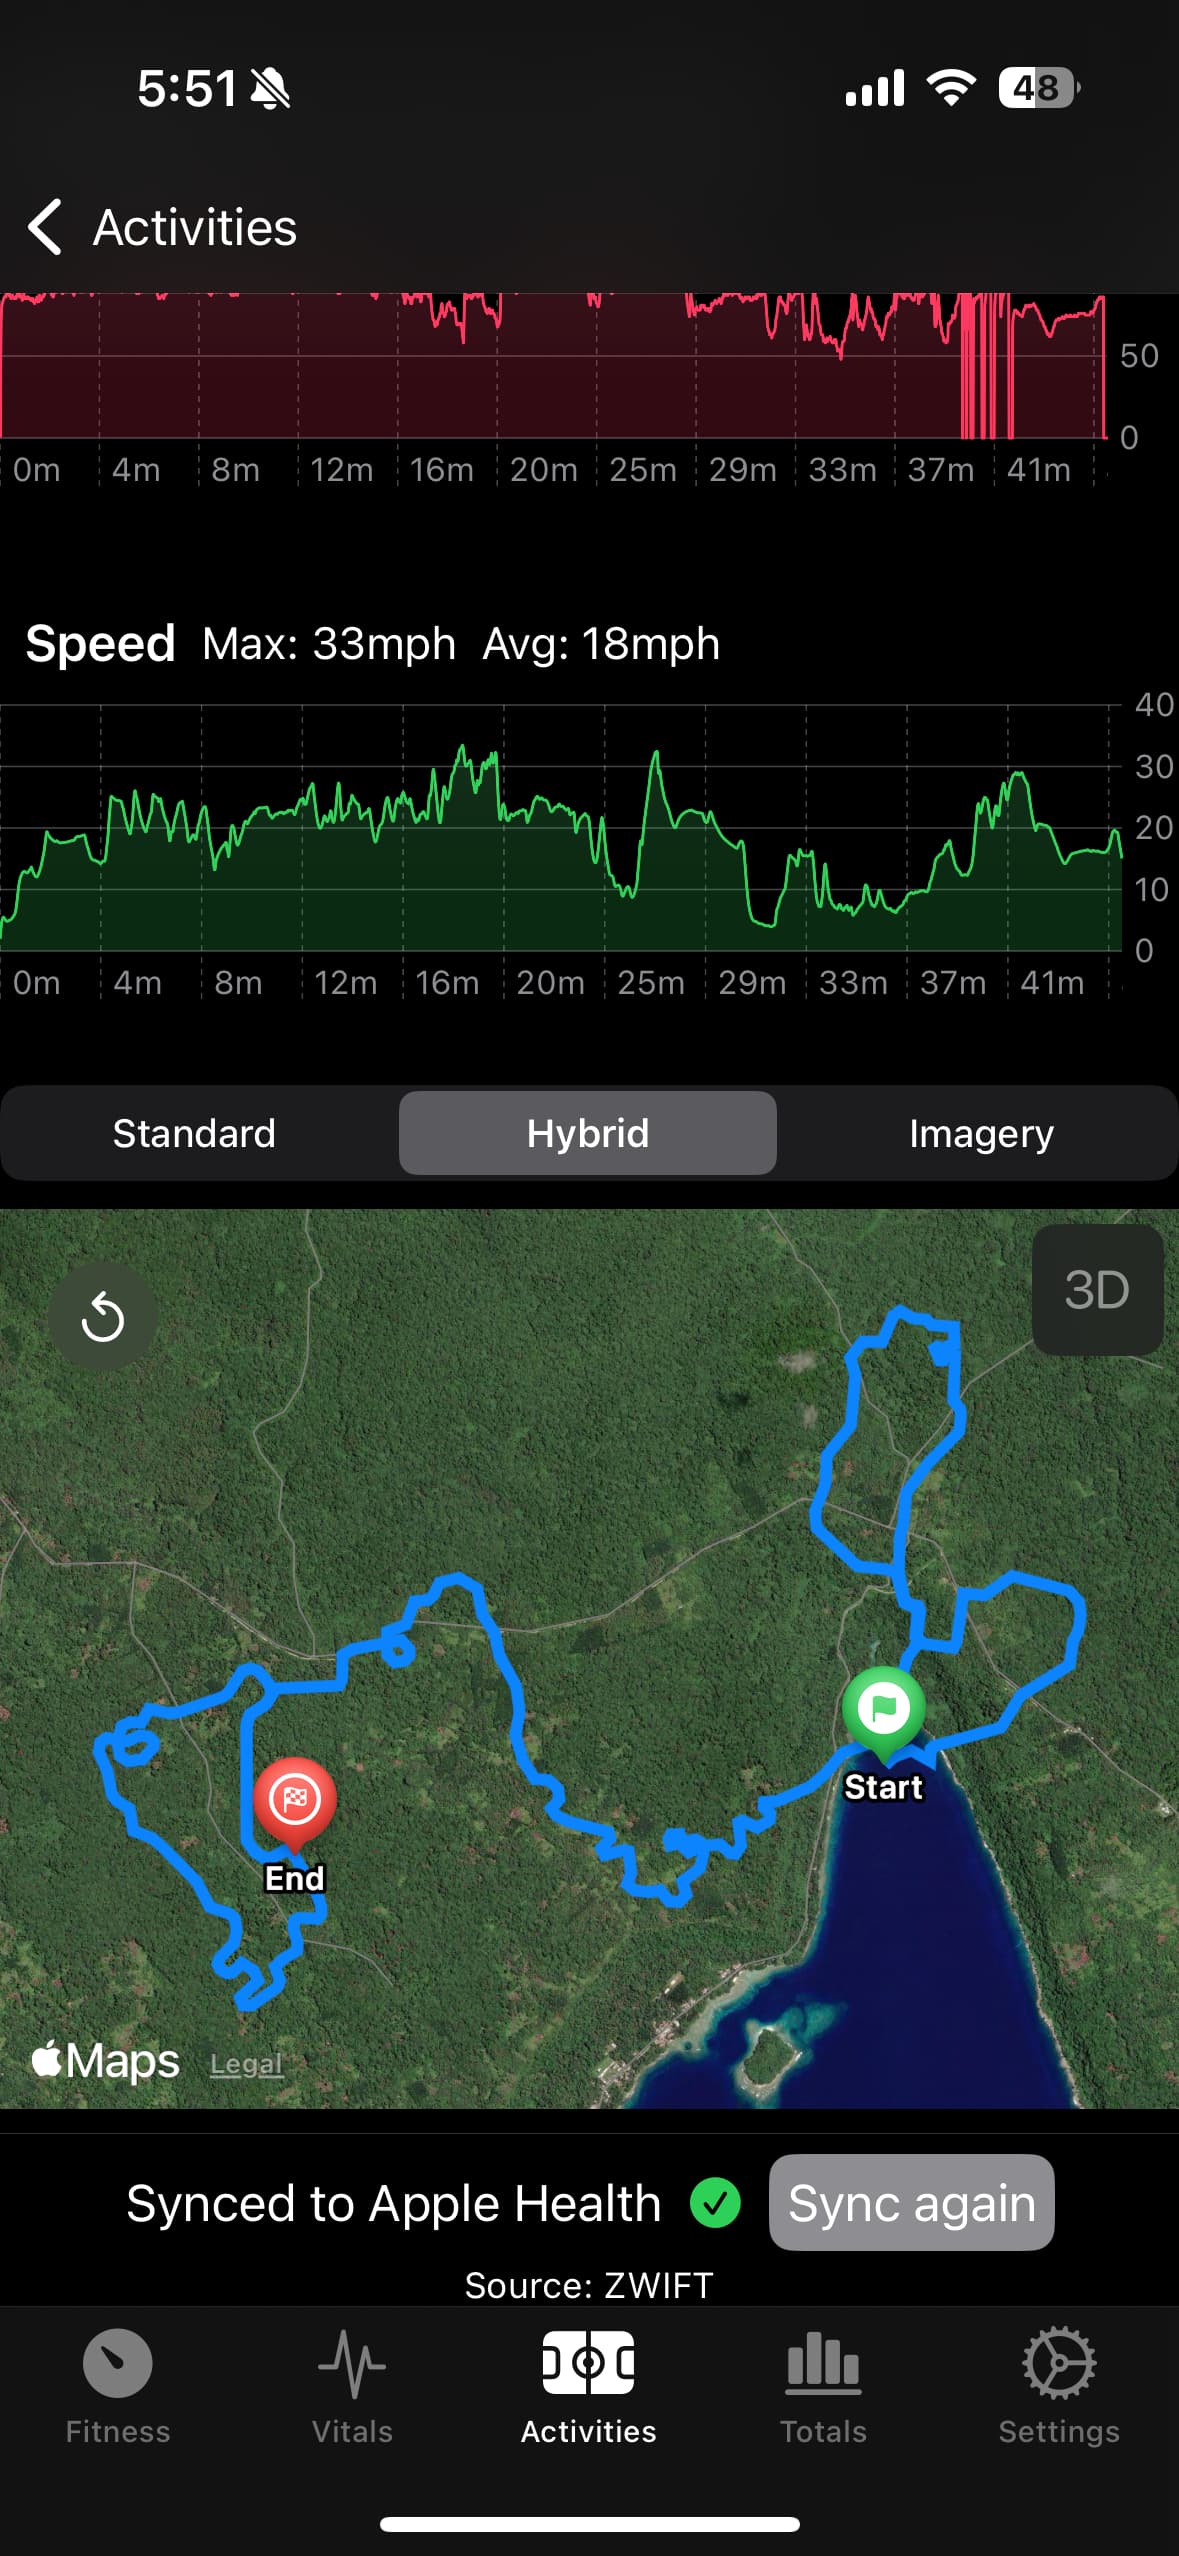
Map only shows for activities, if there is map data, at the bottom of the activities detail screen.
My bad, didn’t logout. Editing works now.
About the map, I do have workouts where it shows a map on ICU but not on the app.
The map should be fixed in the latest TestFlight version. Turns out there are 2 ways to get the route data from the API. There must be a difference in how clients write data to intervals.icu. Using the other way seems to work with both my Garmin synced data and Healthfit
Awesome! Map is showing, thanks.
Saw some rendering issues with the track between “Hybrid” and “Imagery”.
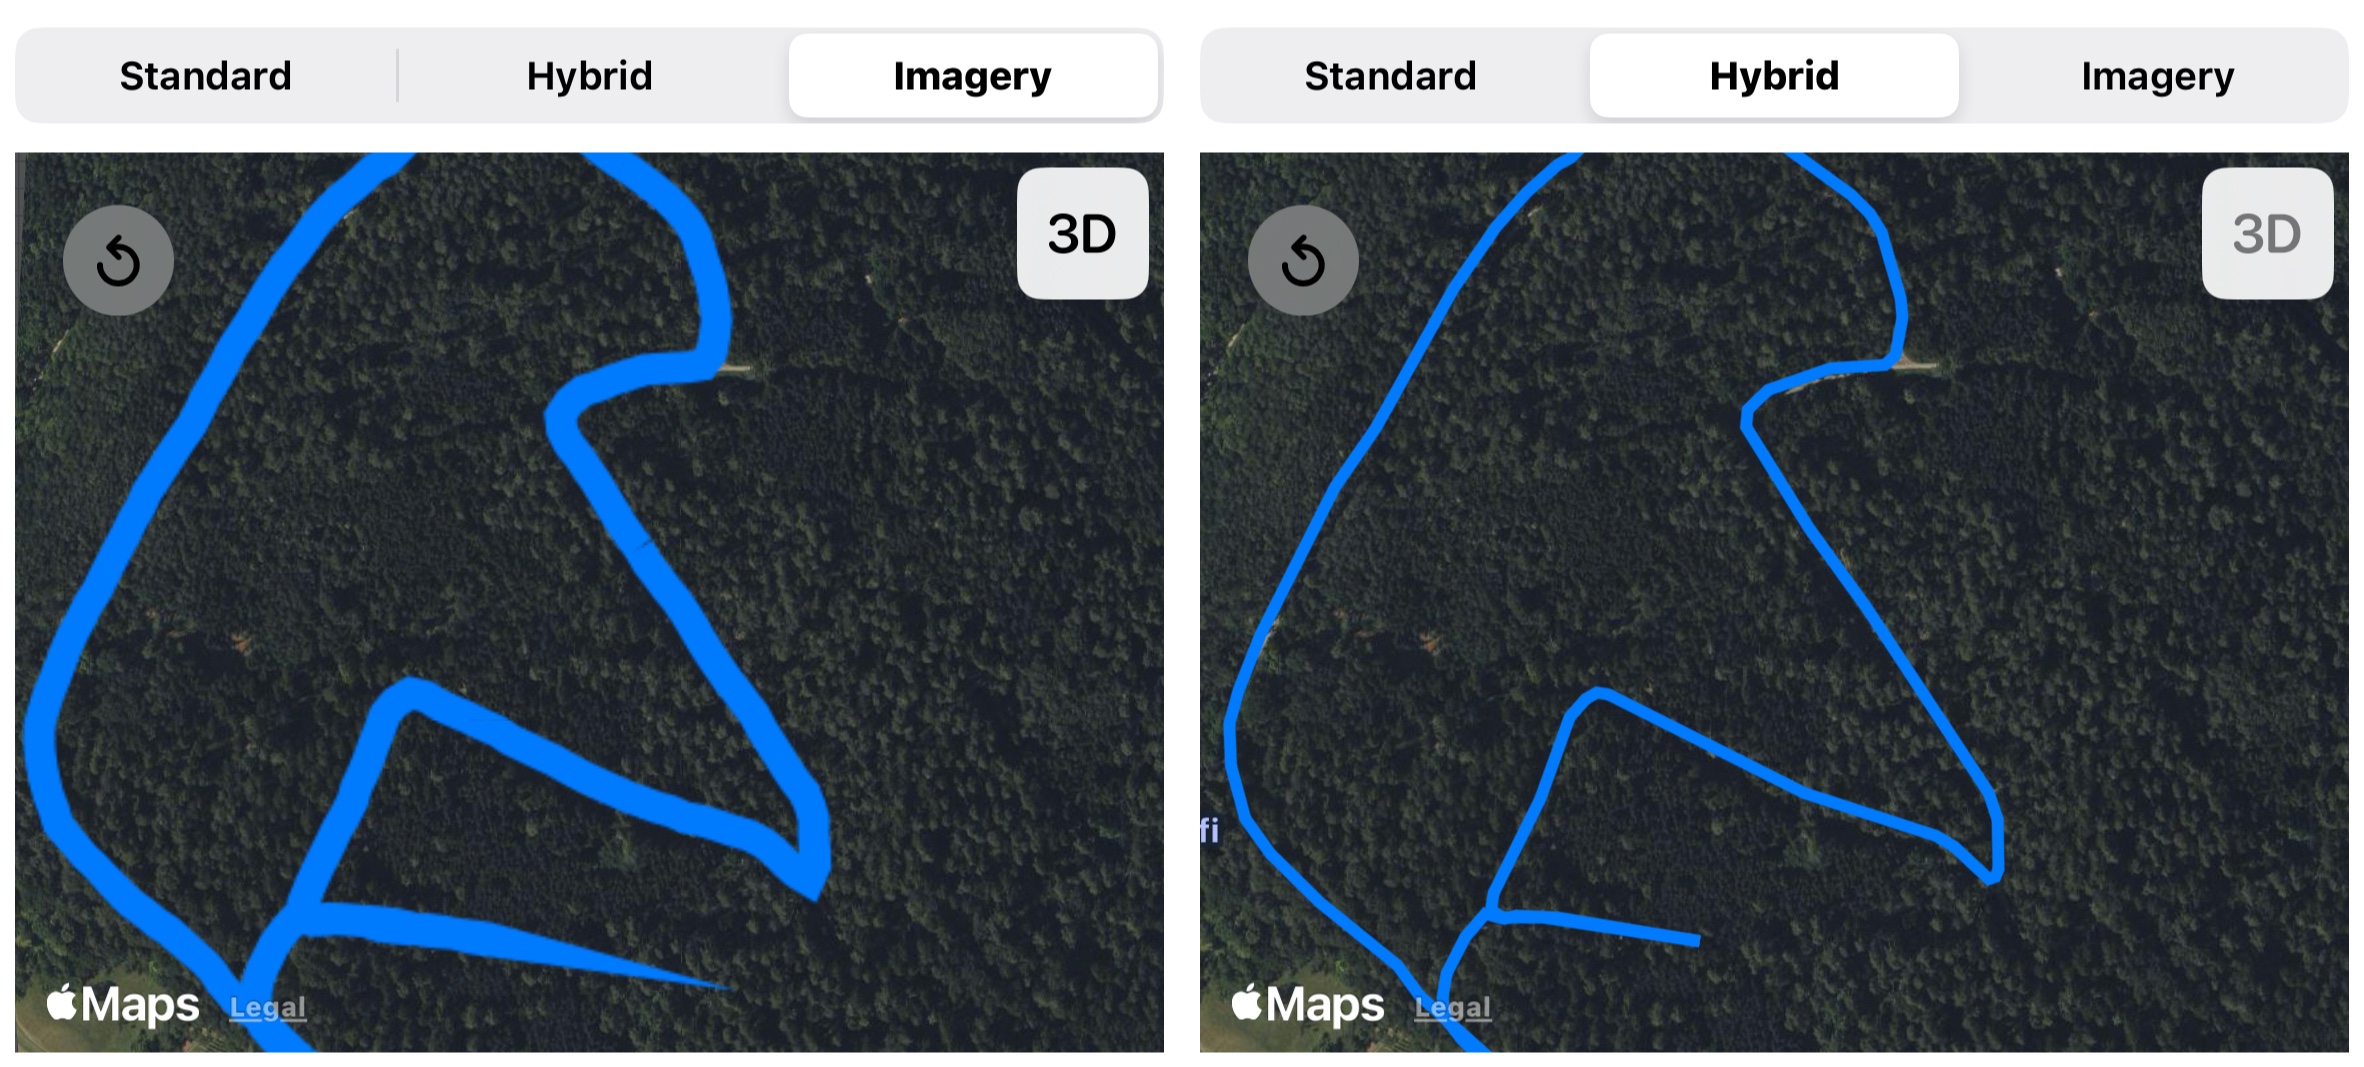
I noticed that too. The map styles are just options set on the map itself, the same points are sent regardless. So it seems like this is more of an Apple issue. If you zoom in on the imagery option it should look better.
A few updates:
I have been letting 1.4 hang out for little while in TestFlight to make sure there are no major issues. I started doing some performance tuning of the fitness screen graphs and that led to some fairly significant refactoring. I think this was worth my effort and has resulted in much more streamlined and efficient code. It appears to be stable and I’m not seeing any crashes reported so it’s time to release it to everyone. It has been submitted to Apple and should be available in the next 12-24 hours. The changes are:
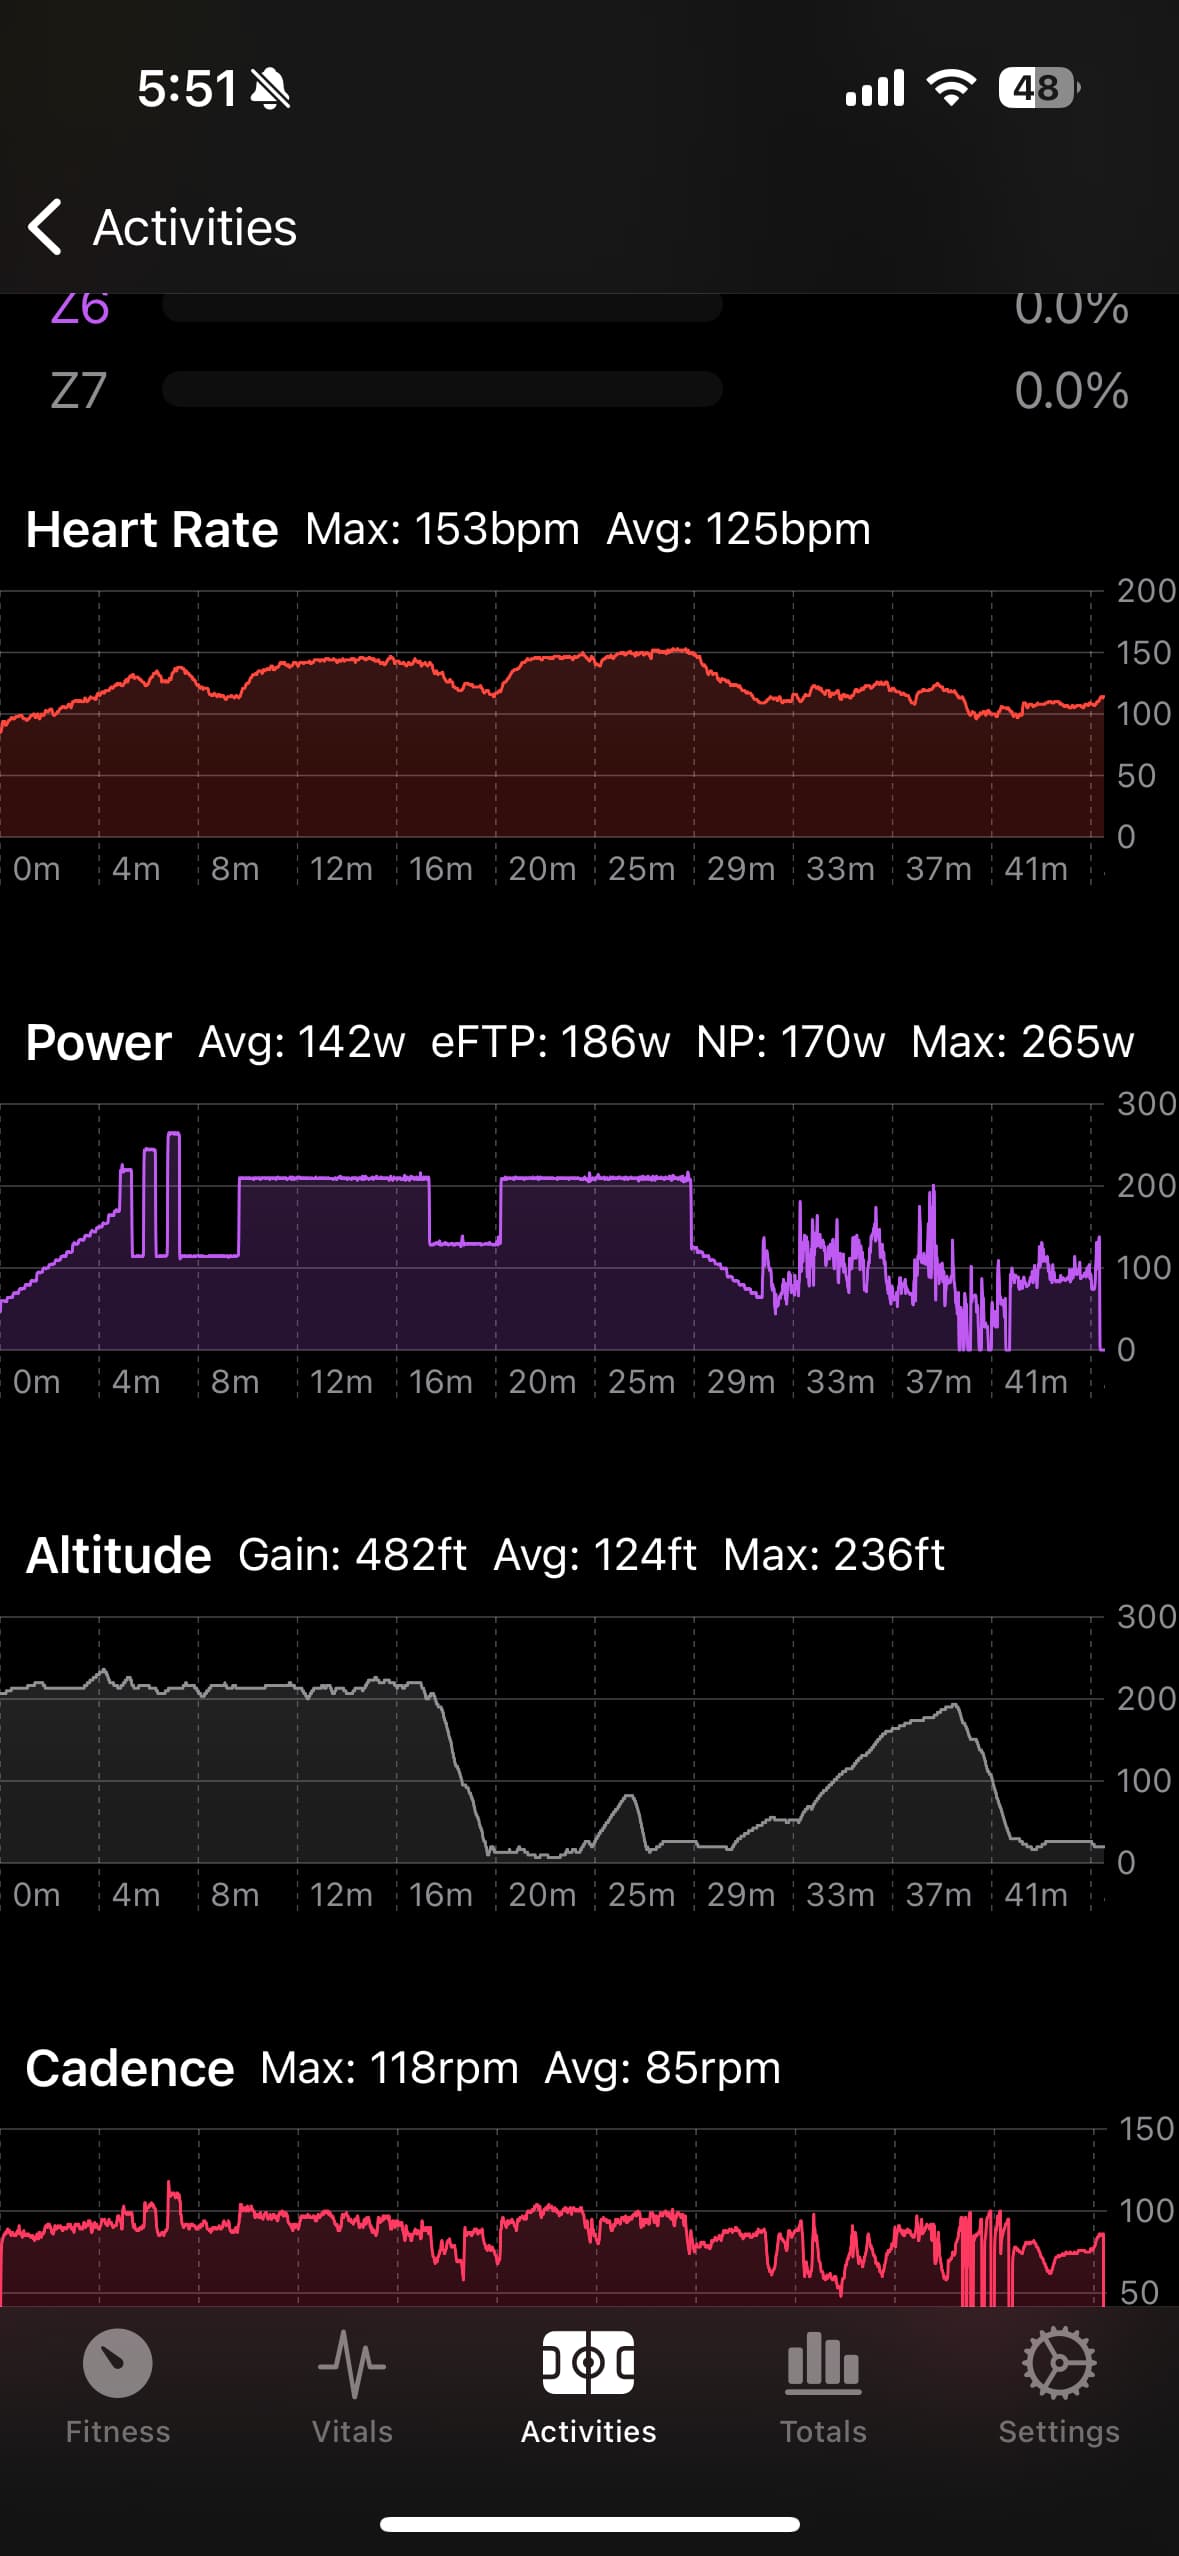
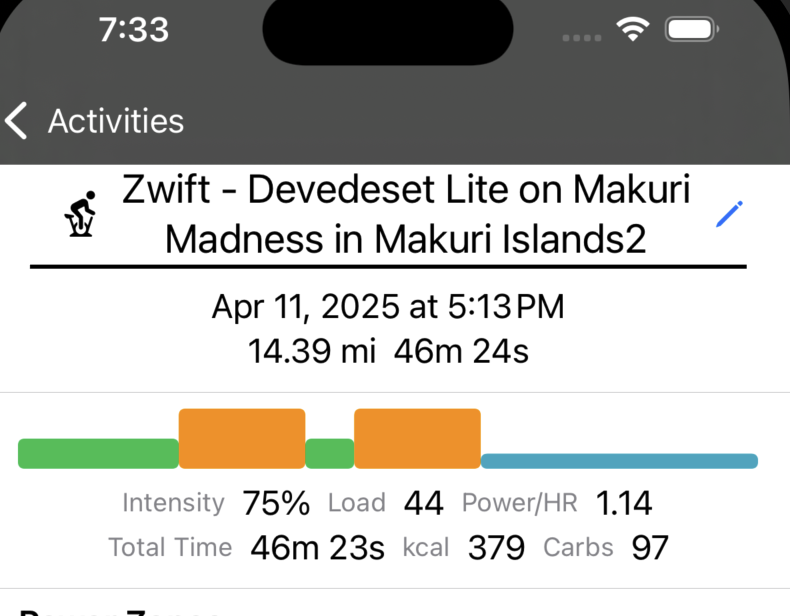
- Redesigned activity details screen with:
- Time spent in power and HR zones
- Interactive HR, power, speed, cadence and elevation graphs.
- Option in settings to use your resting HR as the HR graph lower bound with signal drop detection
- Power vs HR charts
- Activity map with standard, hybrid, and 3d satellite imagery views
- Edit activity names and descriptions. (enable in settings)
- HRV trend can be added to the fitness screen or as an iOS widget. The graphic shows the 60 day HRV average as a range +/- the standard deviation. The most recent single day and 7 day HRV average is shown within the range. Options to use rMSSD or SDNN measurements on the widget and on the fitness screen.
- Fitness graph performance enhancements
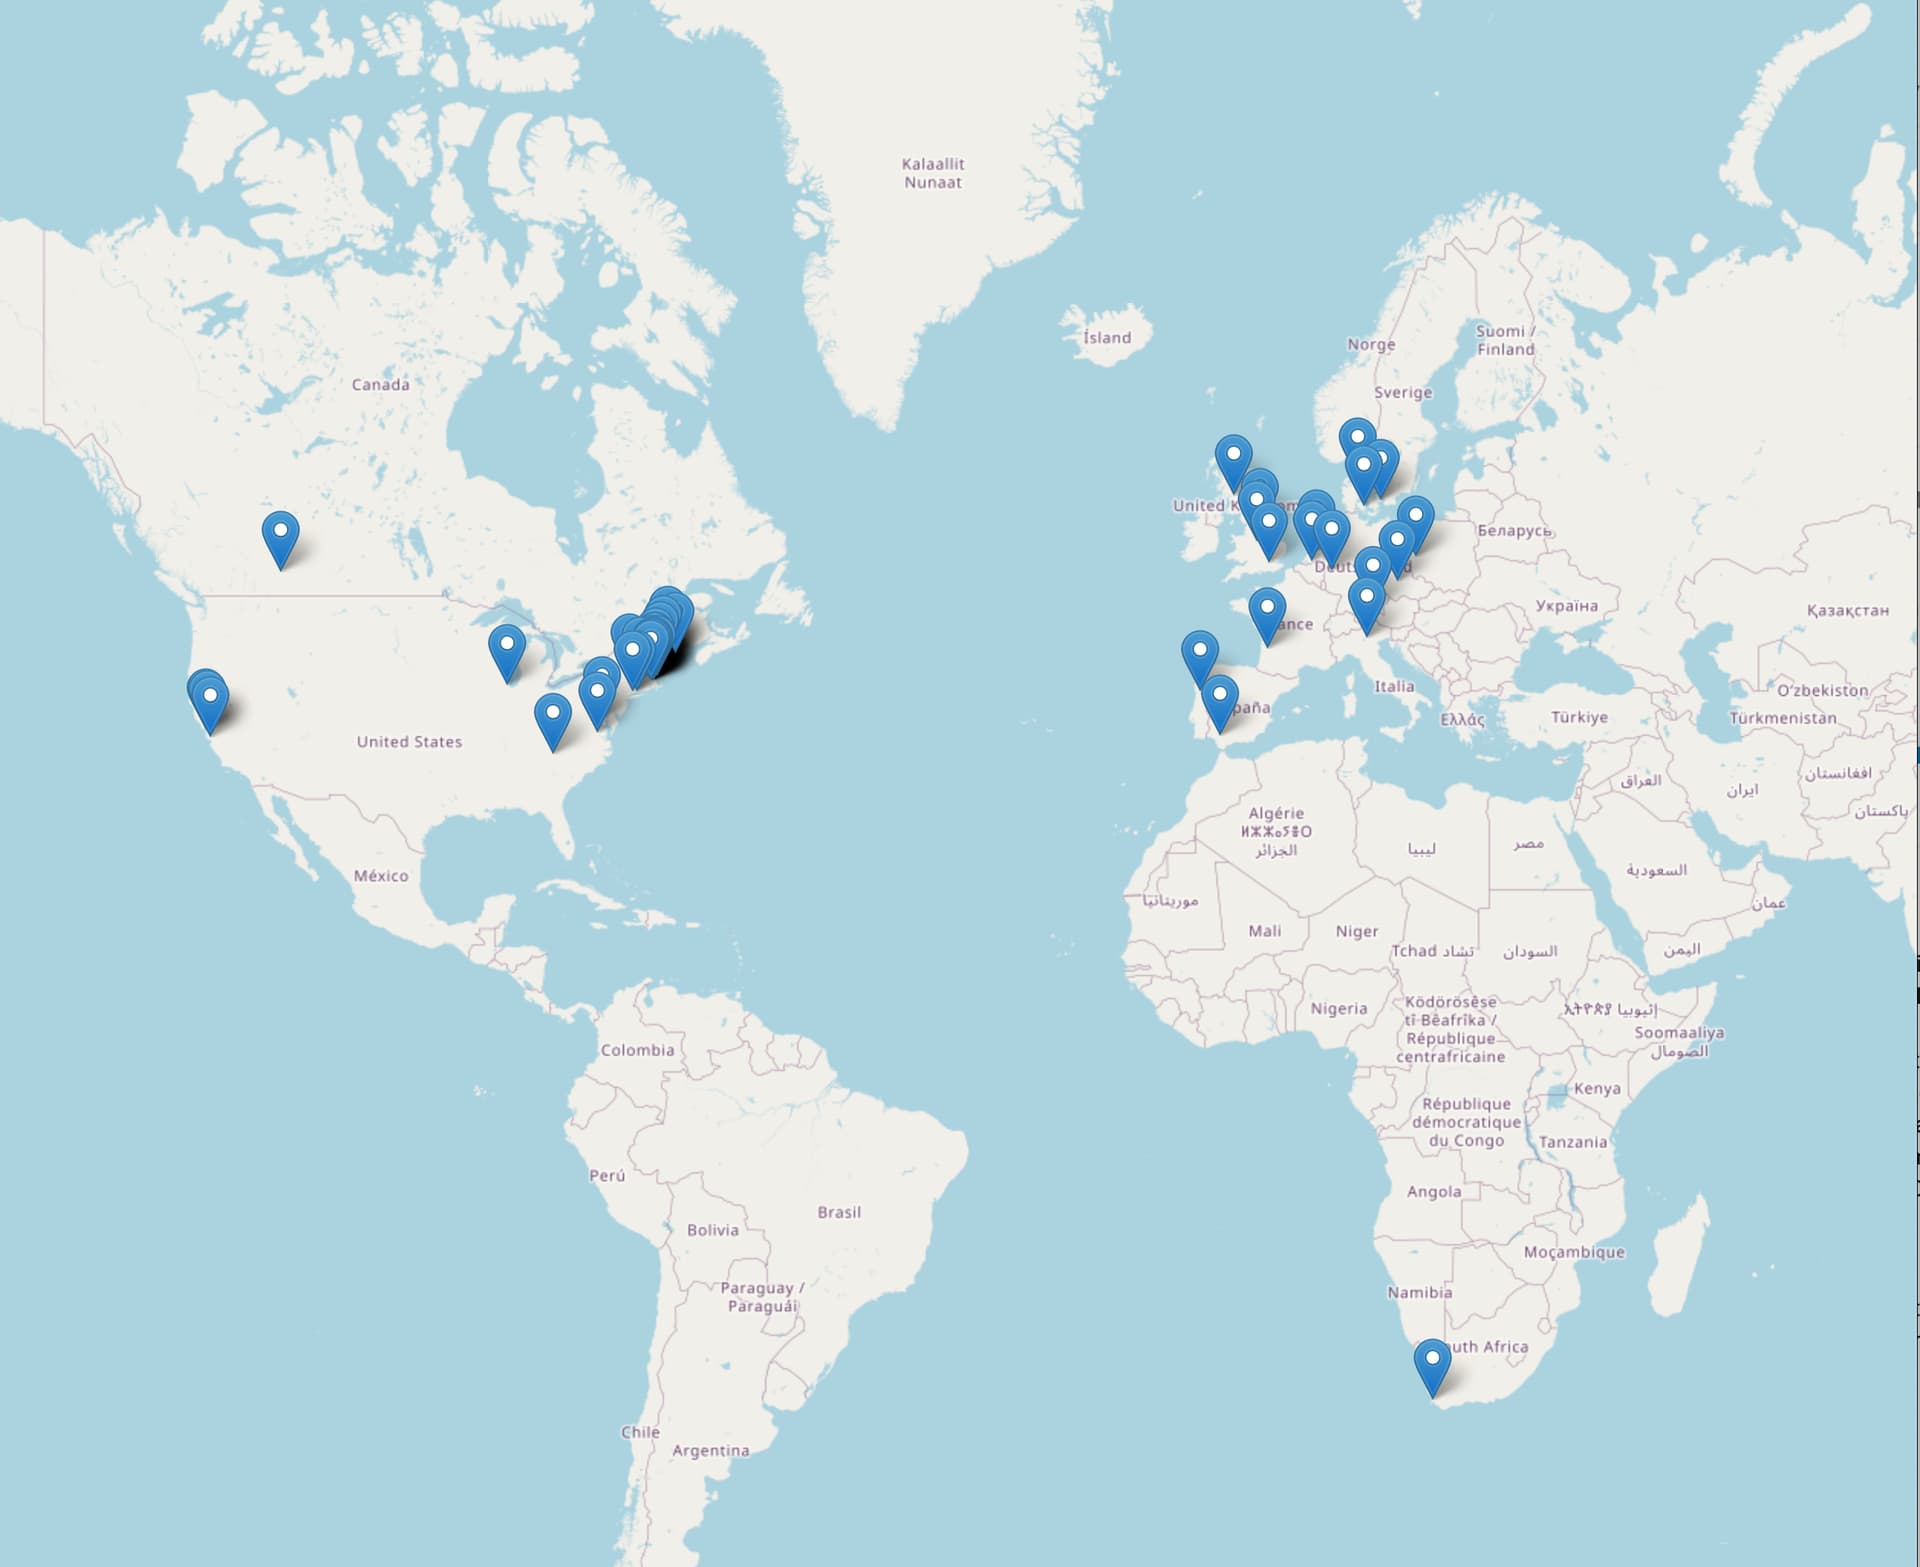
Thanks again for everyone’s feedback and support. About 6000 people have at least tried my little creation so far, and there are about 3000 daily sessions. The app has raised over $400 for my Pan-Mass Challenge fundraiser. It has been incredible to see donations come in from people all over the world. See the map below. Thank you for your generosity and support!
3 Likes
Now that you are allowing edits, I’d love to be able to apply ignores on dual recordings in-app.
I’m really loving your totals page, it is helping me ‘keep’ to the 10% rule as I start to increase my running. It would be good if the website or your app had some intelligence to help some new to the sport like a distance/time/effort trendline at ~10% per week.
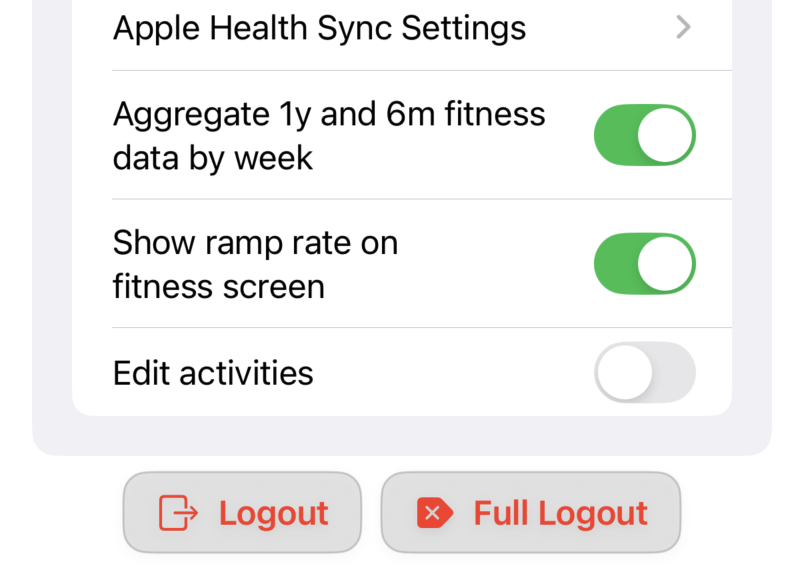
I haven’t used the ignore flags so I’m not entirely sure how those work. I see these settings on an activity though - do you mean these?
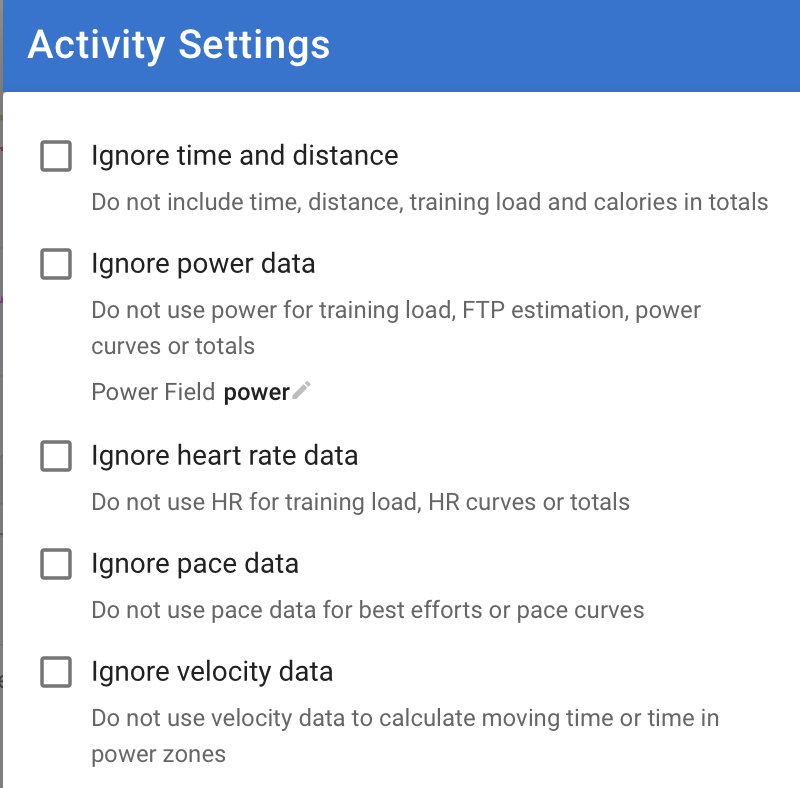
If so, should be pretty simple to add them to the edit screen.
Interesting idea about the trendline. I’ll have to think about that.The ramp rate will also show into the future if you have workouts planned on your calendar. I guess that won’t tell you how much time or distance you need next week over the prior week to stay to a 10% increase though.
1 Like