Hello,
I have been thinking that I would find very useful to be able to see a rolling average of the weekly distance run over the last 6 weeks.
For example, I track weekly distance, as a 7d moving total. To check how that short-term moving total compares to what I have been running longer-term, I’d like to be able to put on a graph the 7day moving total of the last 42 days (that is, 42d moving total / 7), That way I could see that on average during the last 6 weeks I ran say 70 km, but this week I ran 75 km, on the same graph.
Then I could track how my “chronic” weekly distance relates to my “acute” weekly distance.
At the moment this can be done only with the dayle average (using 7d moving average and 42d moving average), which gives very low numbers that are unfamiliar to runners, that often track distance in weeks.
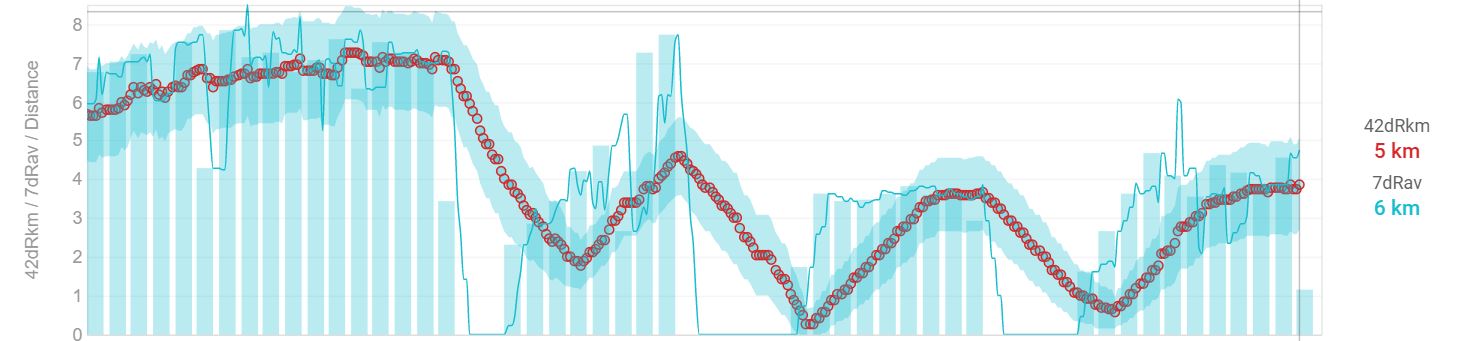
See image, it says 5 km/day averaged during the last 6 weeks, 6 km/day during the last 7 days. That is a 20% increase due to lack of decimals, so it is not great that we cannot get more precision.
I’d like to see, for example, 37 km/week during the last 42 days, 43 km/week during the last 7 days.
I think it would also be very useful for other metrics, such as load, sRPE, duration, elevation, etc., since most of us are probably more used to thinking in weeks than in days.