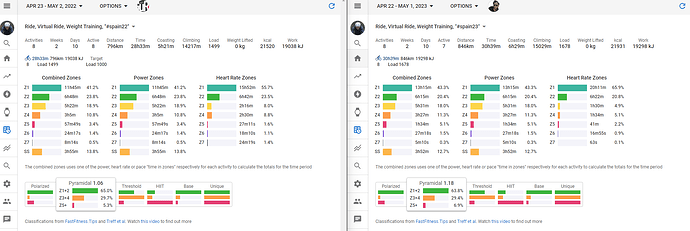
Can I create a chart/summary of training camp data from different years? I would like to compare data such as load, duration, elevation, time in zone
You can do this by having 2 browsers open and selecting the time period on the /totals page…here is an example of 2 different years training camps…
Hi. Thank you very much, Can I save this date filter? Do I have to set it every time?
No worries - you currently have to save select the date filter each time…but there is another live thread on the board where david is looking to build the capability to save the date range selected: Configure activity filter
Hello Piotr,
maybe this option is also suitable for you.
Go to “Compare” in the left margin column and select any time period. Then add charts with the desired parameters. This view is saved.
Cheers Pit
Thank you very much for your help. The best thing for me was using totals and tagging activities. Is it possible to set summary data or are they default?
I don’t know if I understand you correctly. For the charts there is the option “cumulative total”. This displays the summed values of the two time periods on the right-hand side of the x-axis.
The four diagrams show the cumulative values (Load, Moving time, Distance, Time in Z3+Z4) for the respective period of training after a Covid illness.


