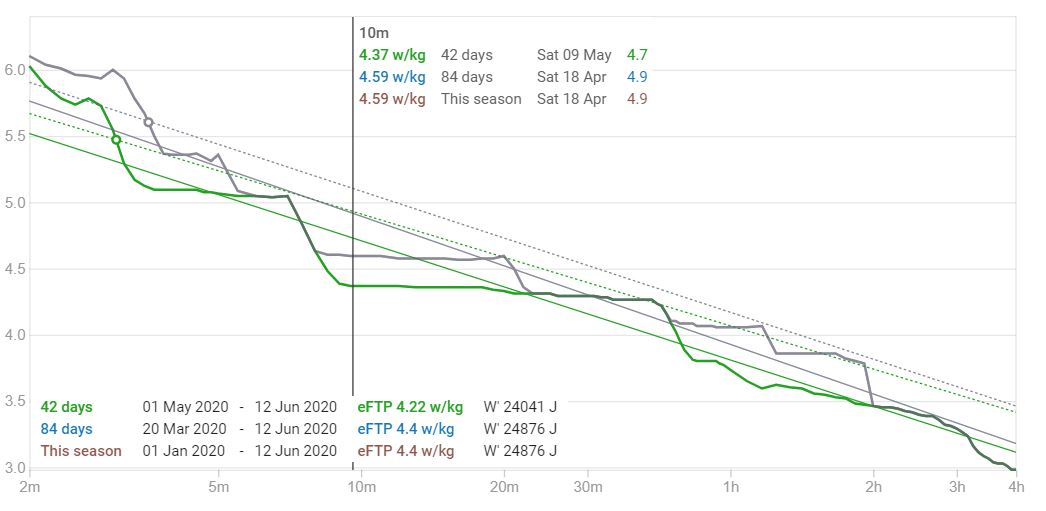
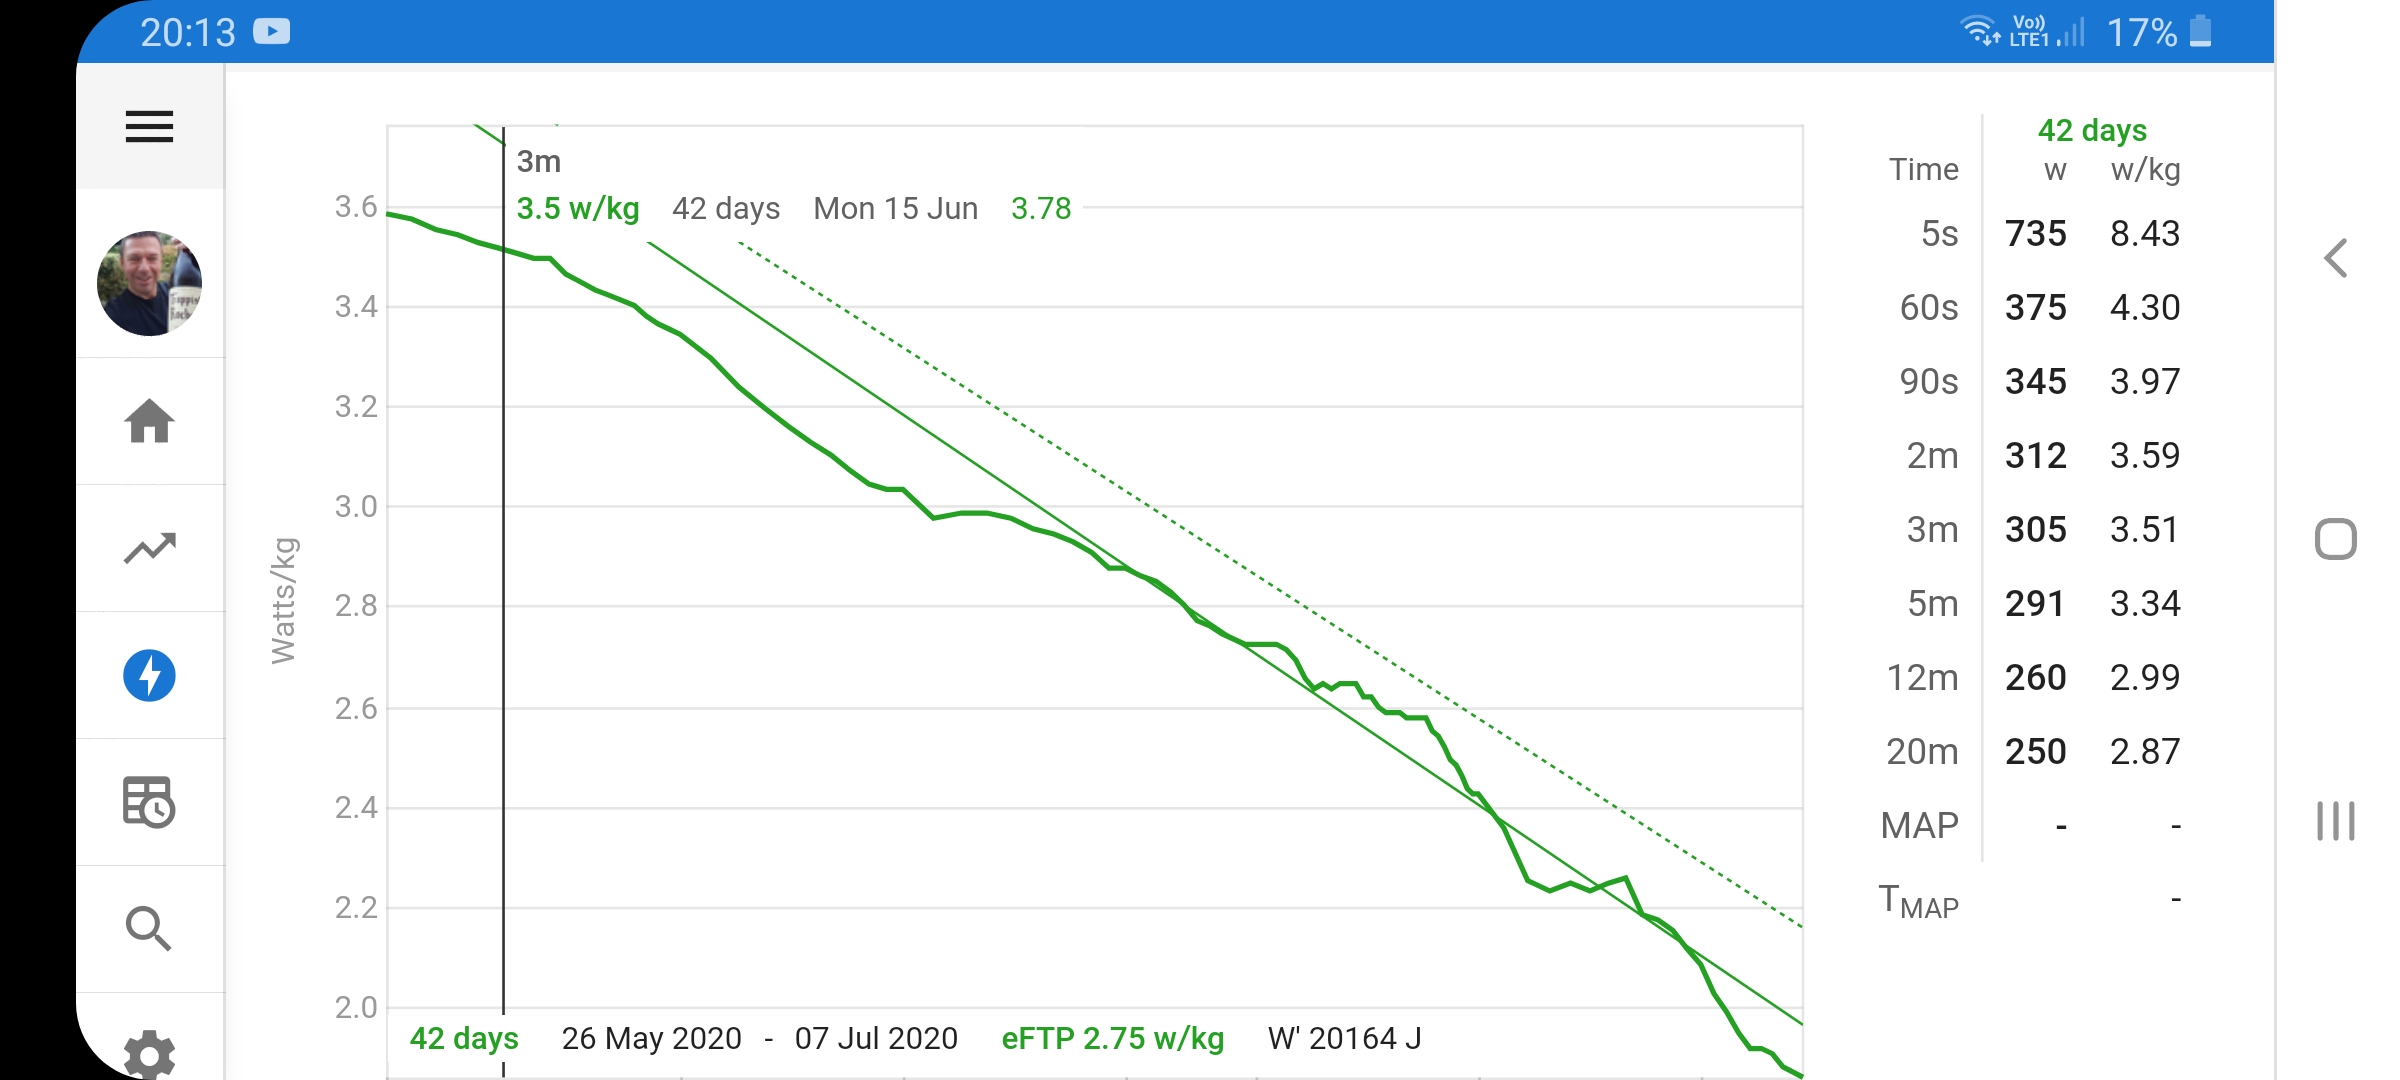
The observation I would make is this: in the paper, measurements are reported for discrete times – eg, 4h, 3h, 2h, 1h and so on down – whereas you have presented a [nearly] continuous PD curve. Your PD curve has a lot more points at the right hand end than the paper’s PD example. So the weight of the observations at the right hand end is greater in your curve than in the paper’s. This means that your regression line is weighted more to the observations on the right than in the paper; this has the effect of making the regression line fit the right hand observations better and the left hand [short duration] observations worse than if you had fewer observations on the right. In other words, your regression line is flatter than it would be if you used the paper’s discrete times. With steeper regression lines, your middle graph would perhaps give a MAP duration of 3.5 minutes and the last graph a duration of 5 minutes. I did a rough check of this [visually estimating your data] and found the middle MASP duration to be about 3.5 minutes.
Also note that the paper starts from 2 min, not 3.
This method seems therefore to depend heavily on the choice of durations at which power is measured.
Incidentally, how do we get hold of our PD data to check this out?
Just according to the paper. I still need to do some more work e.g. no estimate if your power curve is coming up from under the PO 10m-4h line, if the PO model is really bad etc… But if you have a good curve it will work. I also need to add help etc. and other things.
I couldn’t thing of a way to pick points from the power curve instead of using the whole thing. Mine is often bad because of training artefacts i.e. I do 8m efforts a lot, don’t do longer than 14m much (longest climb near my house), hardly ever do long hard rides (cause I don’t like sweet spot!). I don’t have power in races which would fix a lot of this!
Tx. If you change to “MAP” in “Options” on the /power page it shows the PO regression line and the 95% CI line above that with a circle where your MAP is. So you can get an idea if the data is worth something or not (i.e. does your data look like the plots in the paper).
Your power curve needs to come down from above and it the dotted line to count. I think you need to do some max shorter efforts (5m or less) to get a number.
Yes this makes sense as it will move my curve up, maybe I just misinterpreted the reply as it doesn’t read very well grammatically. I think “and it” isn’t meant to be there. Thanks
With the add of VLamax to WKO5 there has been a bump in topics on this subject. Is there finally a proof somewhere that this strategy repeated everywhere by Sebastian Weber is right with real people feedback ? thanks
I use WKO5 and test to keep my PDC data current. When my FTP gets to 83% of the WKO5 pVo2 max estimate, if my goal requires higher FTP or higher pVo2 (for e.g. certain track races), I consider doing some Vo2 max efforts a week for a couple of weeks to ‘raise the ceiling’. If my goal is best acheived by longer time to exhaustion (TTE) at FTP or greater stamina rather than pure higher power (road races, gravel races, sportifs), I continue to try to ride longer at the current FTP to extend TTE and only do a smaller amount of Vo2 max efforts.
Fascinating discussion on the impact of utilizing different training cadences! I particularly appreciate the conversation around balancing high and low cadence to optimize fat burning and muscle endurance. The notion that self-selected cadence might be most beneficial, while exploring wider cadence ranges to improve efficiency, resonates with my own experience.
I’ve experimented with low-cadence sessions to build muscle strength and high-cadence work to enhance endurance and fatigue management. This has helped me become a more versatile cyclist, capable of adapting to various racing scenarios.
I’m curious about how others incorporate cadence into their training, especially in terms of specific preparation for races with varied elevation profiles. Have you found a marked benefit in favoring lower or higher cadences during certain phases of your training?