The 7 day moving average + 30d baseline is standard and derived from hours and hours of number crunching by leading experts in the field. There is nothing to say you have to stick with these standards but they probably are correct for the majority of people.
Check out Marco Altini for more info https://www.marcoaltini.com/
Also search for posts in this forum from @Luisma_Gallego_Soy_P - He is also an expert with years of study in this field.
This thread might also prove useful
HRV-Guided Training
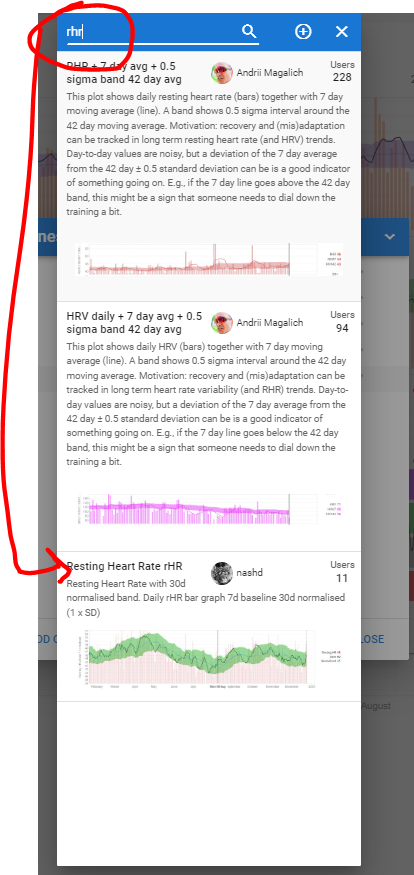
For the graphs:
Go to fitness tab. Search for charts (magnifying glass). Search for rHR and you’ll find a list of existing custom charts.
In my graph below it’s a normalised band of moving 30d average +/- 1 SD and the baseline is a rolling 7d average