Ah! I understand. The two are next to near identical. As far as I can recall they use the same timespan for both normalised and baseline values. EliteHRV uses a 10 day normalised so often gives different recommendations than ithlete
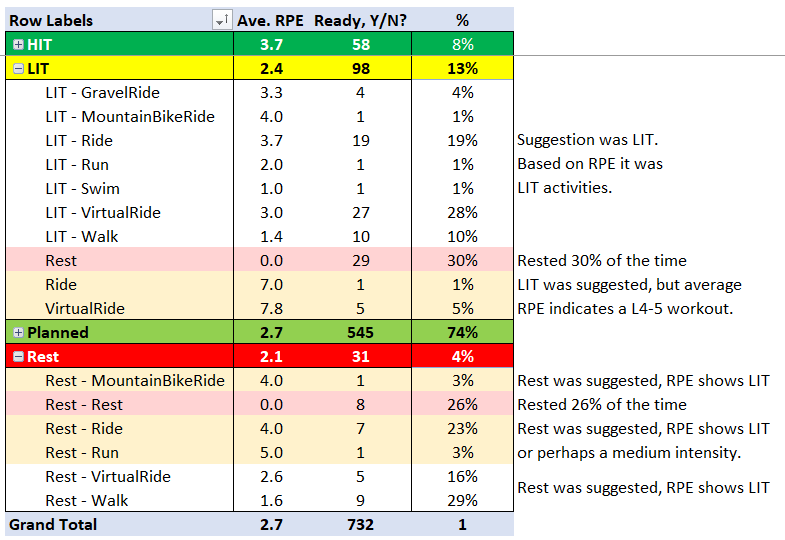
I’ve done a quick (for me) summary of my previous 2 years of data.
I’ve taken the days where HRV suggested LIT or Rest and then the decision I took.
On the days it suggested rest, only 31 days of 732 (4%), I did work out: all listed as good days.
For the LIT days:
- I rested for 29 days (30% of LIT suggested days).
- Only 6 hard workouts were done,but these were:
- 1 race - a bunch finish (83% intensity). Imagine deciding to not race because HRV & ImReady4 suggested LIT, yet I felt good. It could have been anxiety before the race.
- A 20-min FTP test (+19 W increase)
- 3 threshold workouts (3x8m and 4x11m)
- 1 workout at VO2max power (6x2m)
edit: the 545 Proceed as “planned” suggestion also include “planned” rest days (154 days, 28.3% of the time). The original post doesn’t imply that I only rest 4% of the 2 years.
That’s a classic one. Simply the excitement for such an event will result in a HRV value that is historically low. My advice: take the measurement but refrain from looking at the result if you can resist the urge. Never, ever let that result influence your decision on participating or not. Even if you don’t feel very well, just start the event. There is 95% chance that you will feel like superman after 30-45minutes. On the condition that you were correctly prepared for it off course. It’s pure mental conditioning.
- Download and install the ImReady4 app.
- Create an account and set up your profile.
- Connect your HRV monitor to the app.
- Select “HRV Guided Training” from the main menu.
- Choose your training goal and duration.
- Follow the on-screen instructions for breathing exercises.
- Review your results and track progress over time.
Can you provide the sheet template and API call (if not embedded) that you used to generate this data?
Use Excel’s Power Query, which allows exporting the activities.csv and wellness.csv data. The link to the topic discussed is shown below.
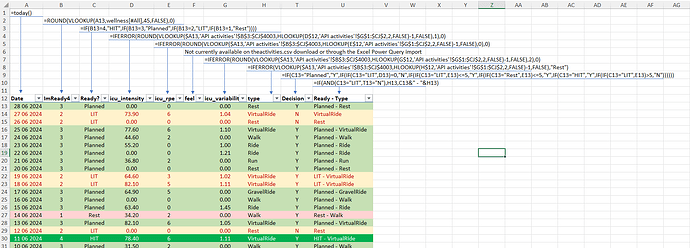
From there I pull RPE, the ride type, Intensity, and the feedback from ImReady4 for each day. From there, it’s a few Excel formulae to join cells together, eg. ImReady4 and Ride Type. I have asked David for more (missing) fields to be included in the activities download, eg. Feel.
The file I am using is my own, but here are the formulae for each line to pull from the Excel file download. Once you have the data, a pivot table can help play with the columns. Or a slicer if you know how to use data in a table format.
Each formula is in column A, B, C, D, E, F, G, H, T and U.
- =today()
- =ROUND(VLOOKUP(A13,wellness[#All],45,FALSE),0)
- =IF(B13=4,HIT,IF(B13=3,Planned,IF(B13=2,LIT,IF(B13=1,Rest))))
- =IFERROR(ROUND(VLOOKUP($A13,‘API activities’!$B$3:$CJ$4003,HLOOKUP(D$12,‘API activities’!$G$1:$CJ$2,2,FALSE)-1,FALSE),1),0)
- =IFERROR(ROUND(VLOOKUP($A13,‘API activities’!$B$3:$CJ$4003,HLOOKUP(E$12,‘API activities’!$G$1:$CJ$2,2,FALSE)-1,FALSE),0),0)
- Not currently available on theactivities.csv download or through the Excel Power Query import
- =IFERROR(ROUND(VLOOKUP($A13,‘API activities’!$B$3:$CJ$4003,HLOOKUP(G$12,‘API activities’!$G$1:$CJ$2,2,FALSE)-1,FALSE),2),0)
- =IFERROR(VLOOKUP($A13,‘API activities’!$B$3:$CJ$4003,HLOOKUP(H$12,‘API activities’!$G$1:$CJ$2,2,FALSE)-1,FALSE),Rest)
- =IF(C13=Planned,Y,IF(IF(C13=LIT,D13)=0,N,IF(IF(C13=LIT,E13)<=5,Y,IF(IF(C13=Rest,E13)<=5,Y,IF(C13=HIT,Y,IF(IF(C13=LIT,E13)>5,N))))))
- =IF(AND(C13=LIT,T13=N),H13,C13& - &H13)
This turned up last week on Mrco’s blog:
I’ve been using ImReady4 for a few years, and I’ve found it pretty useful for pushing me to make a call for adjusting training intensity following a hard day (for example).
Lately I’ve noticed that it has been recommending ‘HIT’ on the day after a hard day, which seems a little unusual. For example, yesterday I rode 24 miles out to do a 10 mile TT, did my best time for several years, then rode 24 miles home again. So quite a hard day for me (in my my 60s). And today ImReady4 has recommended ‘HIT’. I would have expected ‘LIT’ or ‘Planned’. It’s done this several times over the last few weeks, for example on mornings after a particularly tough interval session. The recommendations for the second morning after the intense training day is ‘LIT’ in these cases.
As far as I can see, I’m using the latest script, but I’m just wondering if something in there is causing me to have a recommendation that’s 24h out? How would I track this down?
Just for reference, I usually get up around 5am, measure resting HR, use HRV4Training to assess HRV, and run ImReady4 shortly after that. HRV4Training said to train as planned, TrainerRoad suggests a Rest day - I would normally do an easy spin on a morning like this.
The recommendation isn’t 24 hours out. It’s just how your body has responded to the training.
If your HR and HRV are within normal ranges the day following a difficult session I am not entirely sure how you’d expect the app to give you an ‘LIT’ recommendation. It can only analyse and recommend based on the data inputted.
The algorithm hasn’t changed.
Yes, of course I realise there hasn’t been a change in the script. I was actually wondering whether it is possible that something had changed in the data I’m feeding it from intervals - maybe date related.
I’ve had a number of interruptions to my training since early spring (though I kept measuring rHR and HRV), so this is something that I’ve only recently noticed. And it’s an interesting pattern - that the day after a hard day I get ‘HIT’ (but actually take it easy) and the day after that, ‘LIT’ or "REST’.
The other alternative was that HRV isn’t necessarily a useful measure. I act on my perceived readiness for training intensity more than the recommendations coming via ImReady4, TR or HRV4Training.
You’re correct to listen to your own body over any objective data or readiness scores etc
HRV is a very useful metric. It allows you monitor response to stressor but acute changes don’t necessarily need to be acted upon immediately. Analysis of HRV on a medium to long term basis can be hugely insightful.
I have often noticed my HRV take a dip 48hrs lost a long or difficult training session. This usually corresponds with how I’m feeling though.
Don’t over think HIT or LIT readiness scores. They are mathematical guesstimates of a physiological system and can never be correct all the time.
If you’re getting a HIT readiness score but feel terrible, listen to your body and not the HRV app
Hello Lenny.
Forgive me for writing here but I think it will be quicker to contact you than via CIQ ![]()
I have a question, is there any chance for you to add Fenix8 in the manifest (I think?) of your app?
It is known, at the moment your app cannot be installed in F8 ![]()
greetings
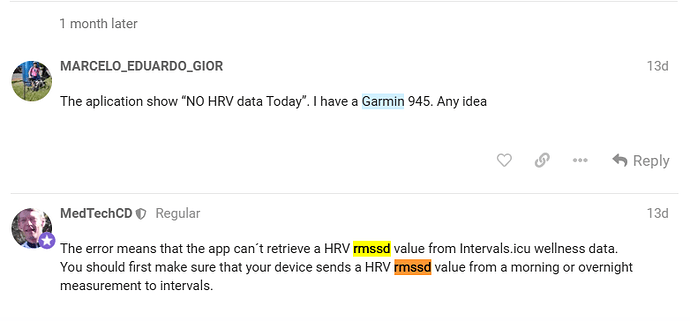
The aplication show “NO HRV data Today”. I have a Garmin 945. Any idea
The error means that the app can´t retrieve a HRV rmssd value from Intervals.icu wellness data.
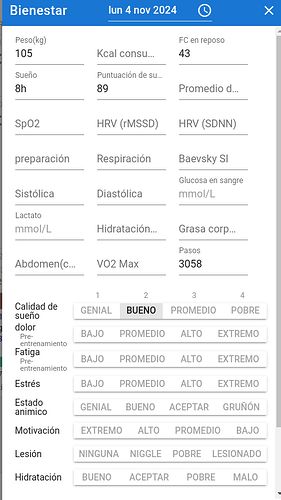
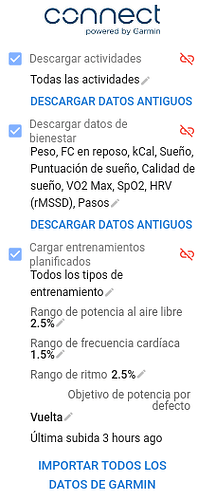
You should first make sure that your device sends a HRV rmssd value from a morning or overnight measurement to intervals.
There are not data in RMSSD and SDNN. Any idea?
Where are you getting your HRV data from? From Garmin 945 overnight score?
Yes, my HRV data is from the overnight score
Is correct?
The ImReady4 app uses the beat-to-beat data from adevice/app to create a HRV score (using SDNN, rMSSD, etc.). I’m not sure what your Garmin sends, which @MedTechCD also posted about in response to your initial query.
