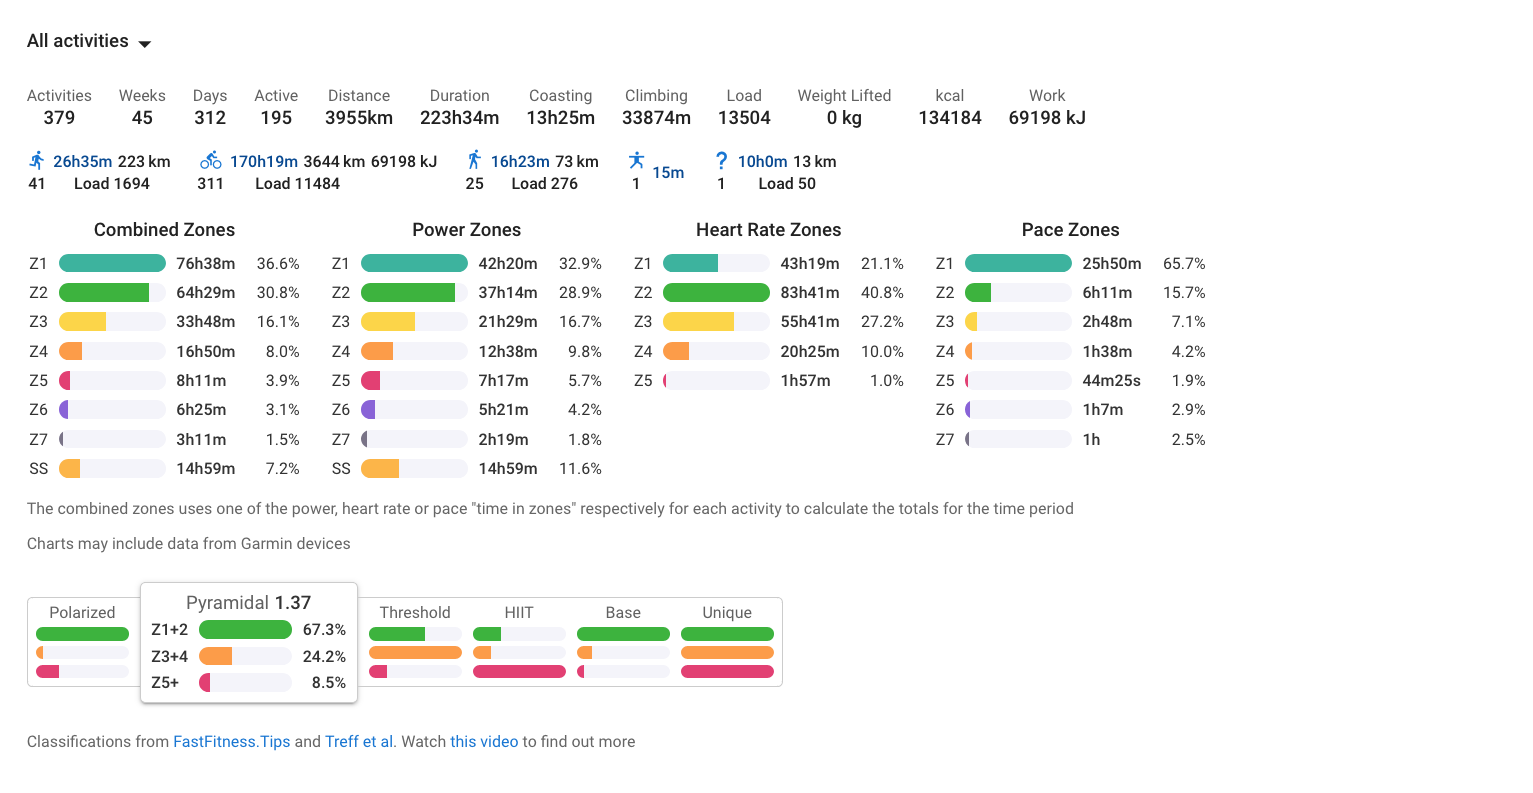
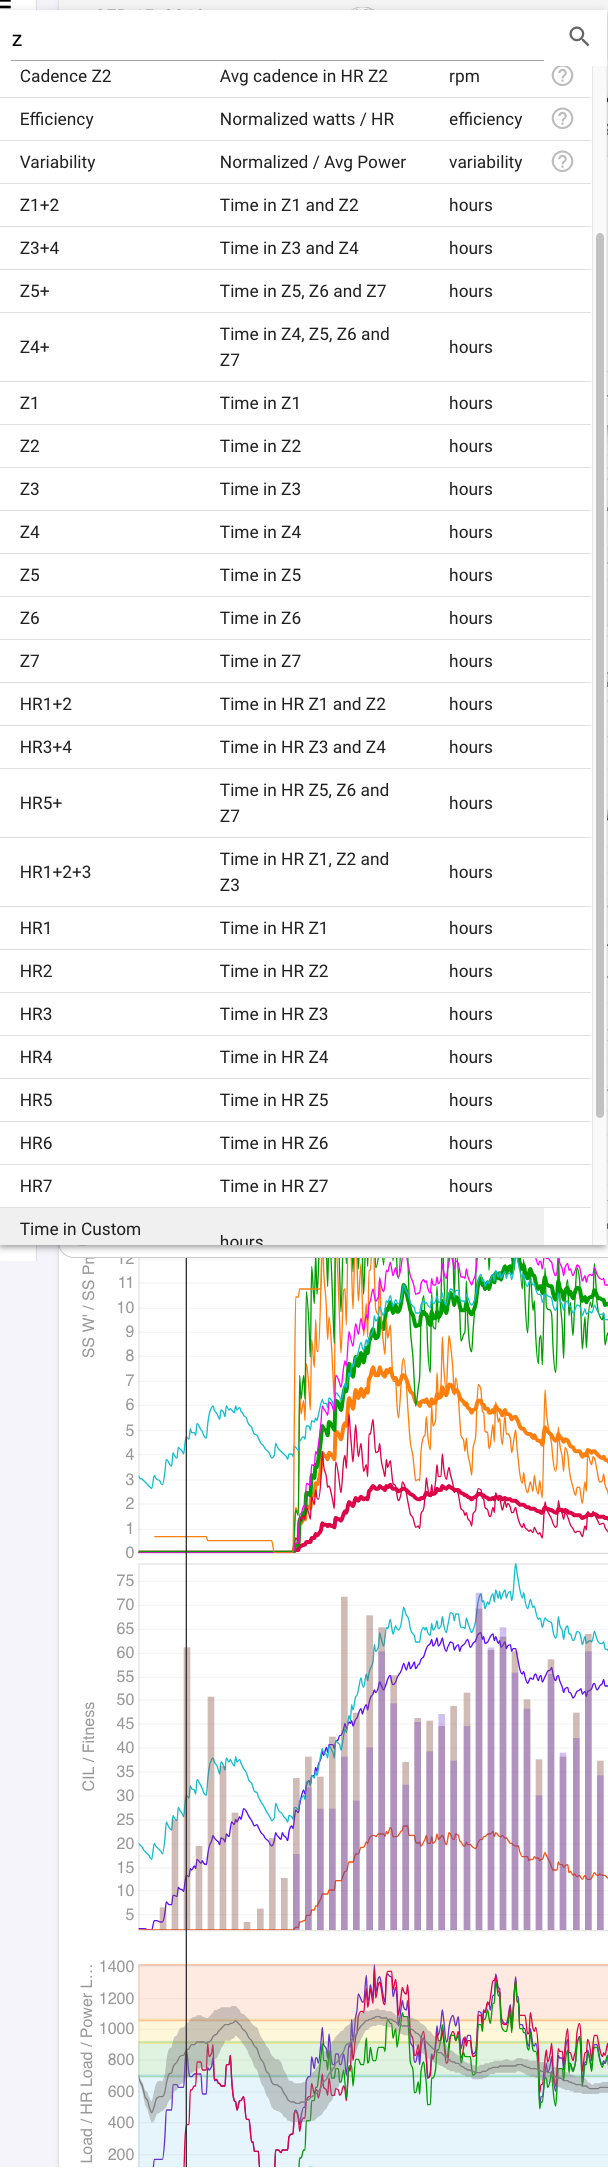
Or is there a combined zones field that I can use for the charts below i.e. like the data on this page (image below)