Maybe but it also has value as an absolute number re the increase in fitness.
I do not feel very tired, don’t feel rested either. I honestly don’t know how I should feel while in the “percentage” green zone.
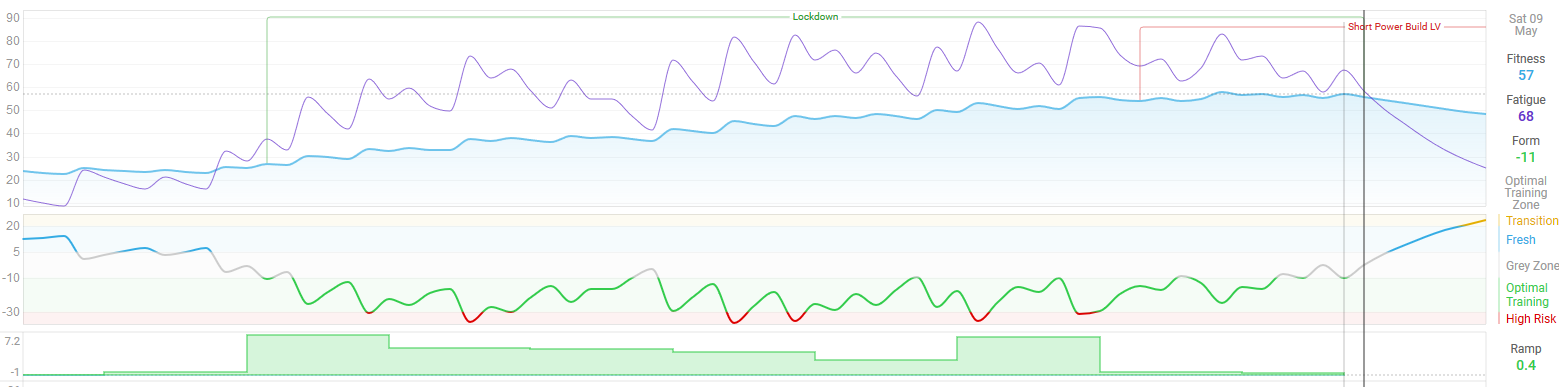
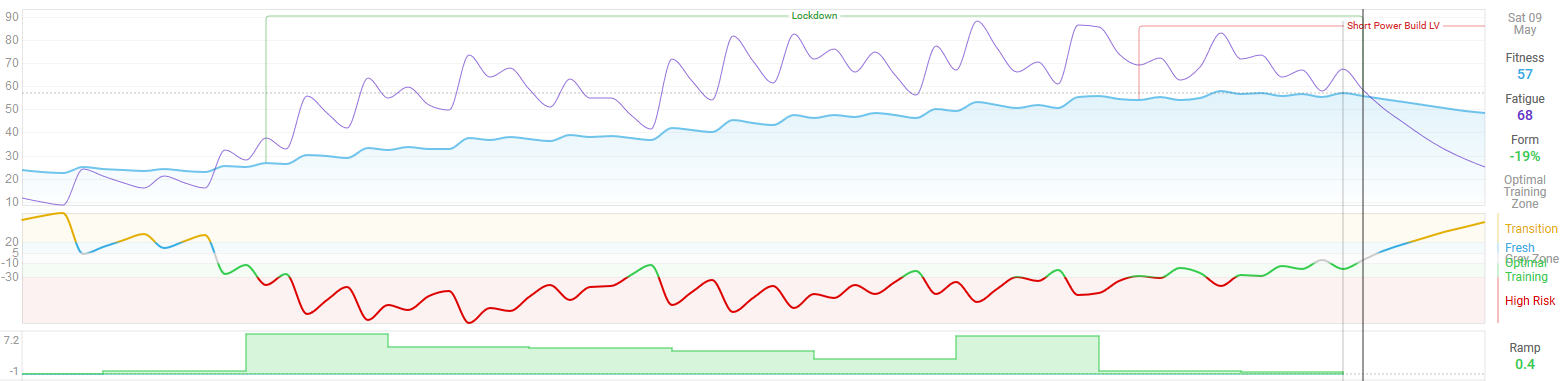
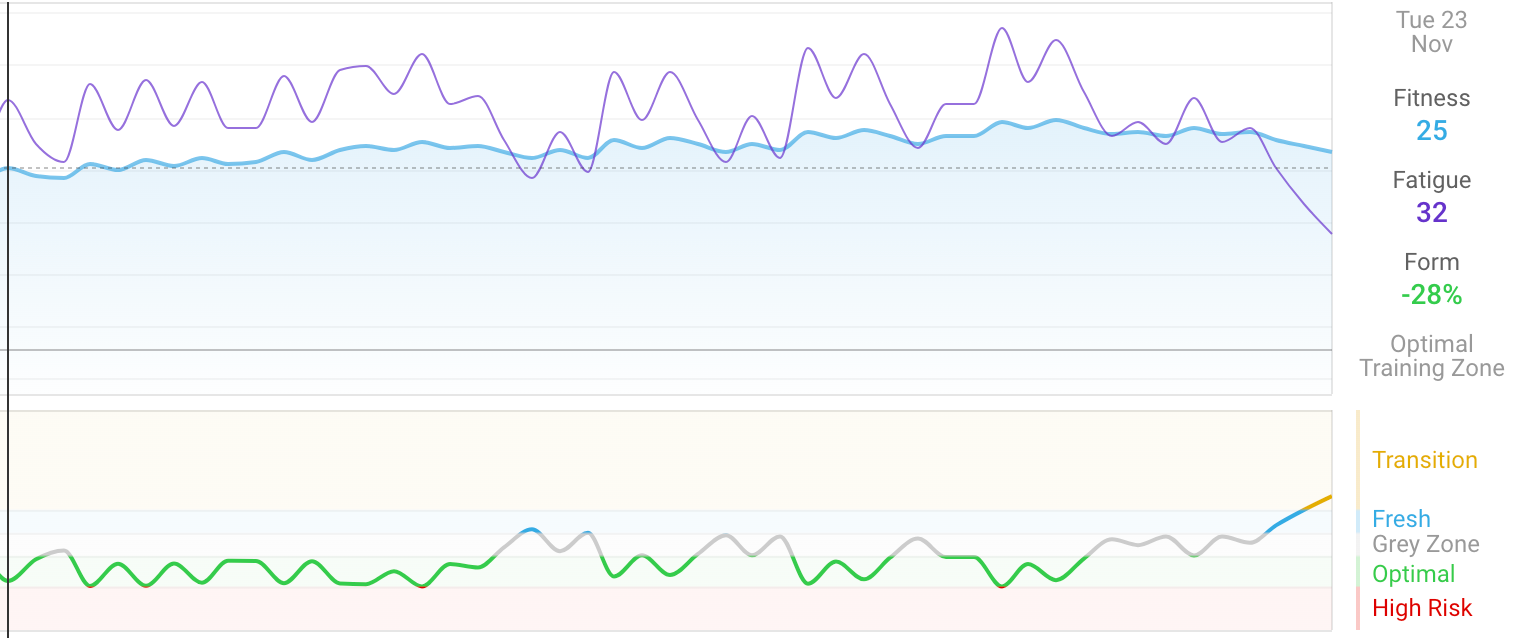
This is a “percentage” screenshot since jan 2018 (only got a powermeter since april 1st 2020).
Seems like I’ve been overtraining most of the time when I made progress.
Not really, you just lack the consistency that this type of fitness/form modelling needs to reflect well on reality.
In this model, fitness decays over 6 weeks, fatigue decays over 1 week. You appear to take frequent training breaks, causing your fitness and fatigue levels to decline at different rates. When you jump back into your normal training habits, your fatigue level shoots back up quickly. These large swings in consistency are not ideal for this approach. It doesn’t necessarily mean it’s a bad way to train, just that this model of training form doesn’t really fit your routine.
3 Likes
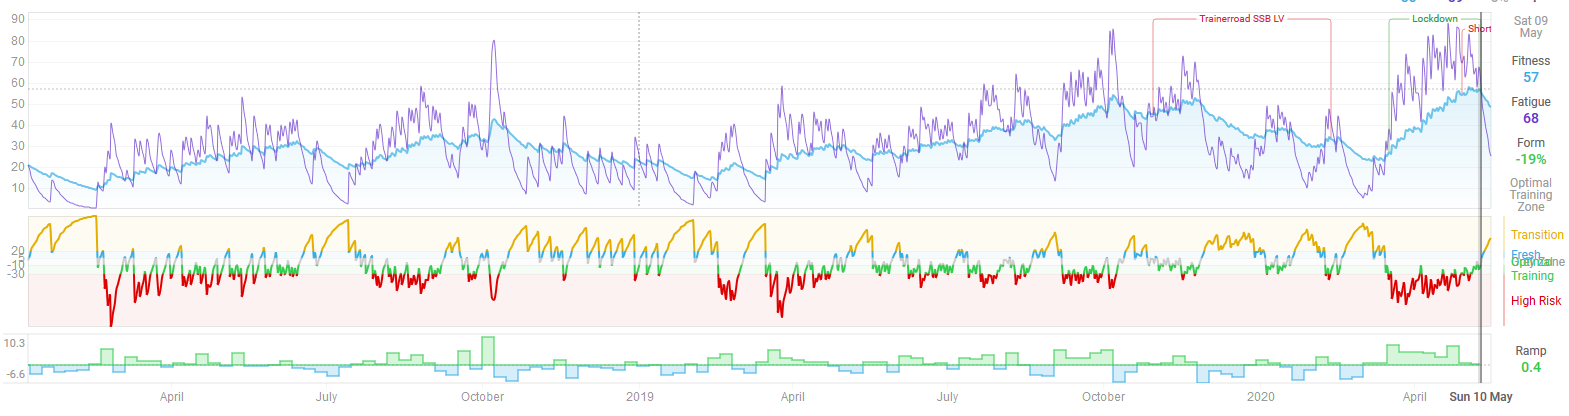
Which shows a much better picture of your training routine/history. Your first screenshot seems to be of about the last month only, where you picked up training considerably.
Also, now having a real PM may skew things a bit, but as @asdfqwerty explained, this ‘redlining’ is to be expected in your case.
Correct, the consistency isn’t my strongsuit. I guess life happens often (hollidays out of the country, skitrips, sickness, bad weather after summer, …) .
I got my indoortrainer end of october last year, so the bad weather has less influence, a part that the indoor training isn’t as long as outdoors, and doesn’t raise my fitness much (if at all).
But a week of sickness and two skitrips dropped the line much more than I liked to see.
The first screenshot was of the last month or so (thx to the lockdown)
I guess I should restart much less intens, and gradually increase volume/intensity.
If I understand it right, redlining at the beginning weeks for a low level rider is to be expected ? Or still to be avoided ?
Tread carefully, listen to your body. This is ALWAYS rule number one. If you can handle what you’re doing now, keep doing it. It’s okay to feel exhausted after a though effort once in a while, but not on a daily or ‘four-out of-five-times-per-week’ basis…
2 Likes
Thx for the insight, I will keep that in mind.
Actually I am glad that @david added the percentage option. After a longer periode of consistency, I sometimes did feel exhausted, and lost the fun in riding.
Il try to stay in the green for a couple of weeks, and see what it does for fitness and morale.
In my opinion, and as someone who does experiments on humans for a living, it’s important to have an independent “biomarker” of exercise stress as a reality check on the input model. It’s also important to remember that exercise is only one of the stressors we are subject to, but they have an additive effect on health and performance.
I use HRV, which has fairly good literature support. I also have the wonderful benefit of breaking out in mouth sores when I really overdo it. Others may have the ability to use performance metrics or self monitor, but I think there’s too much effort dependence and subjectivity in those methods for most of us.
3 Likes
I used to get that quite a bit. Stopped when I started cycling so I assume it was a stress thing. Cruising around on a bike is a good cure!
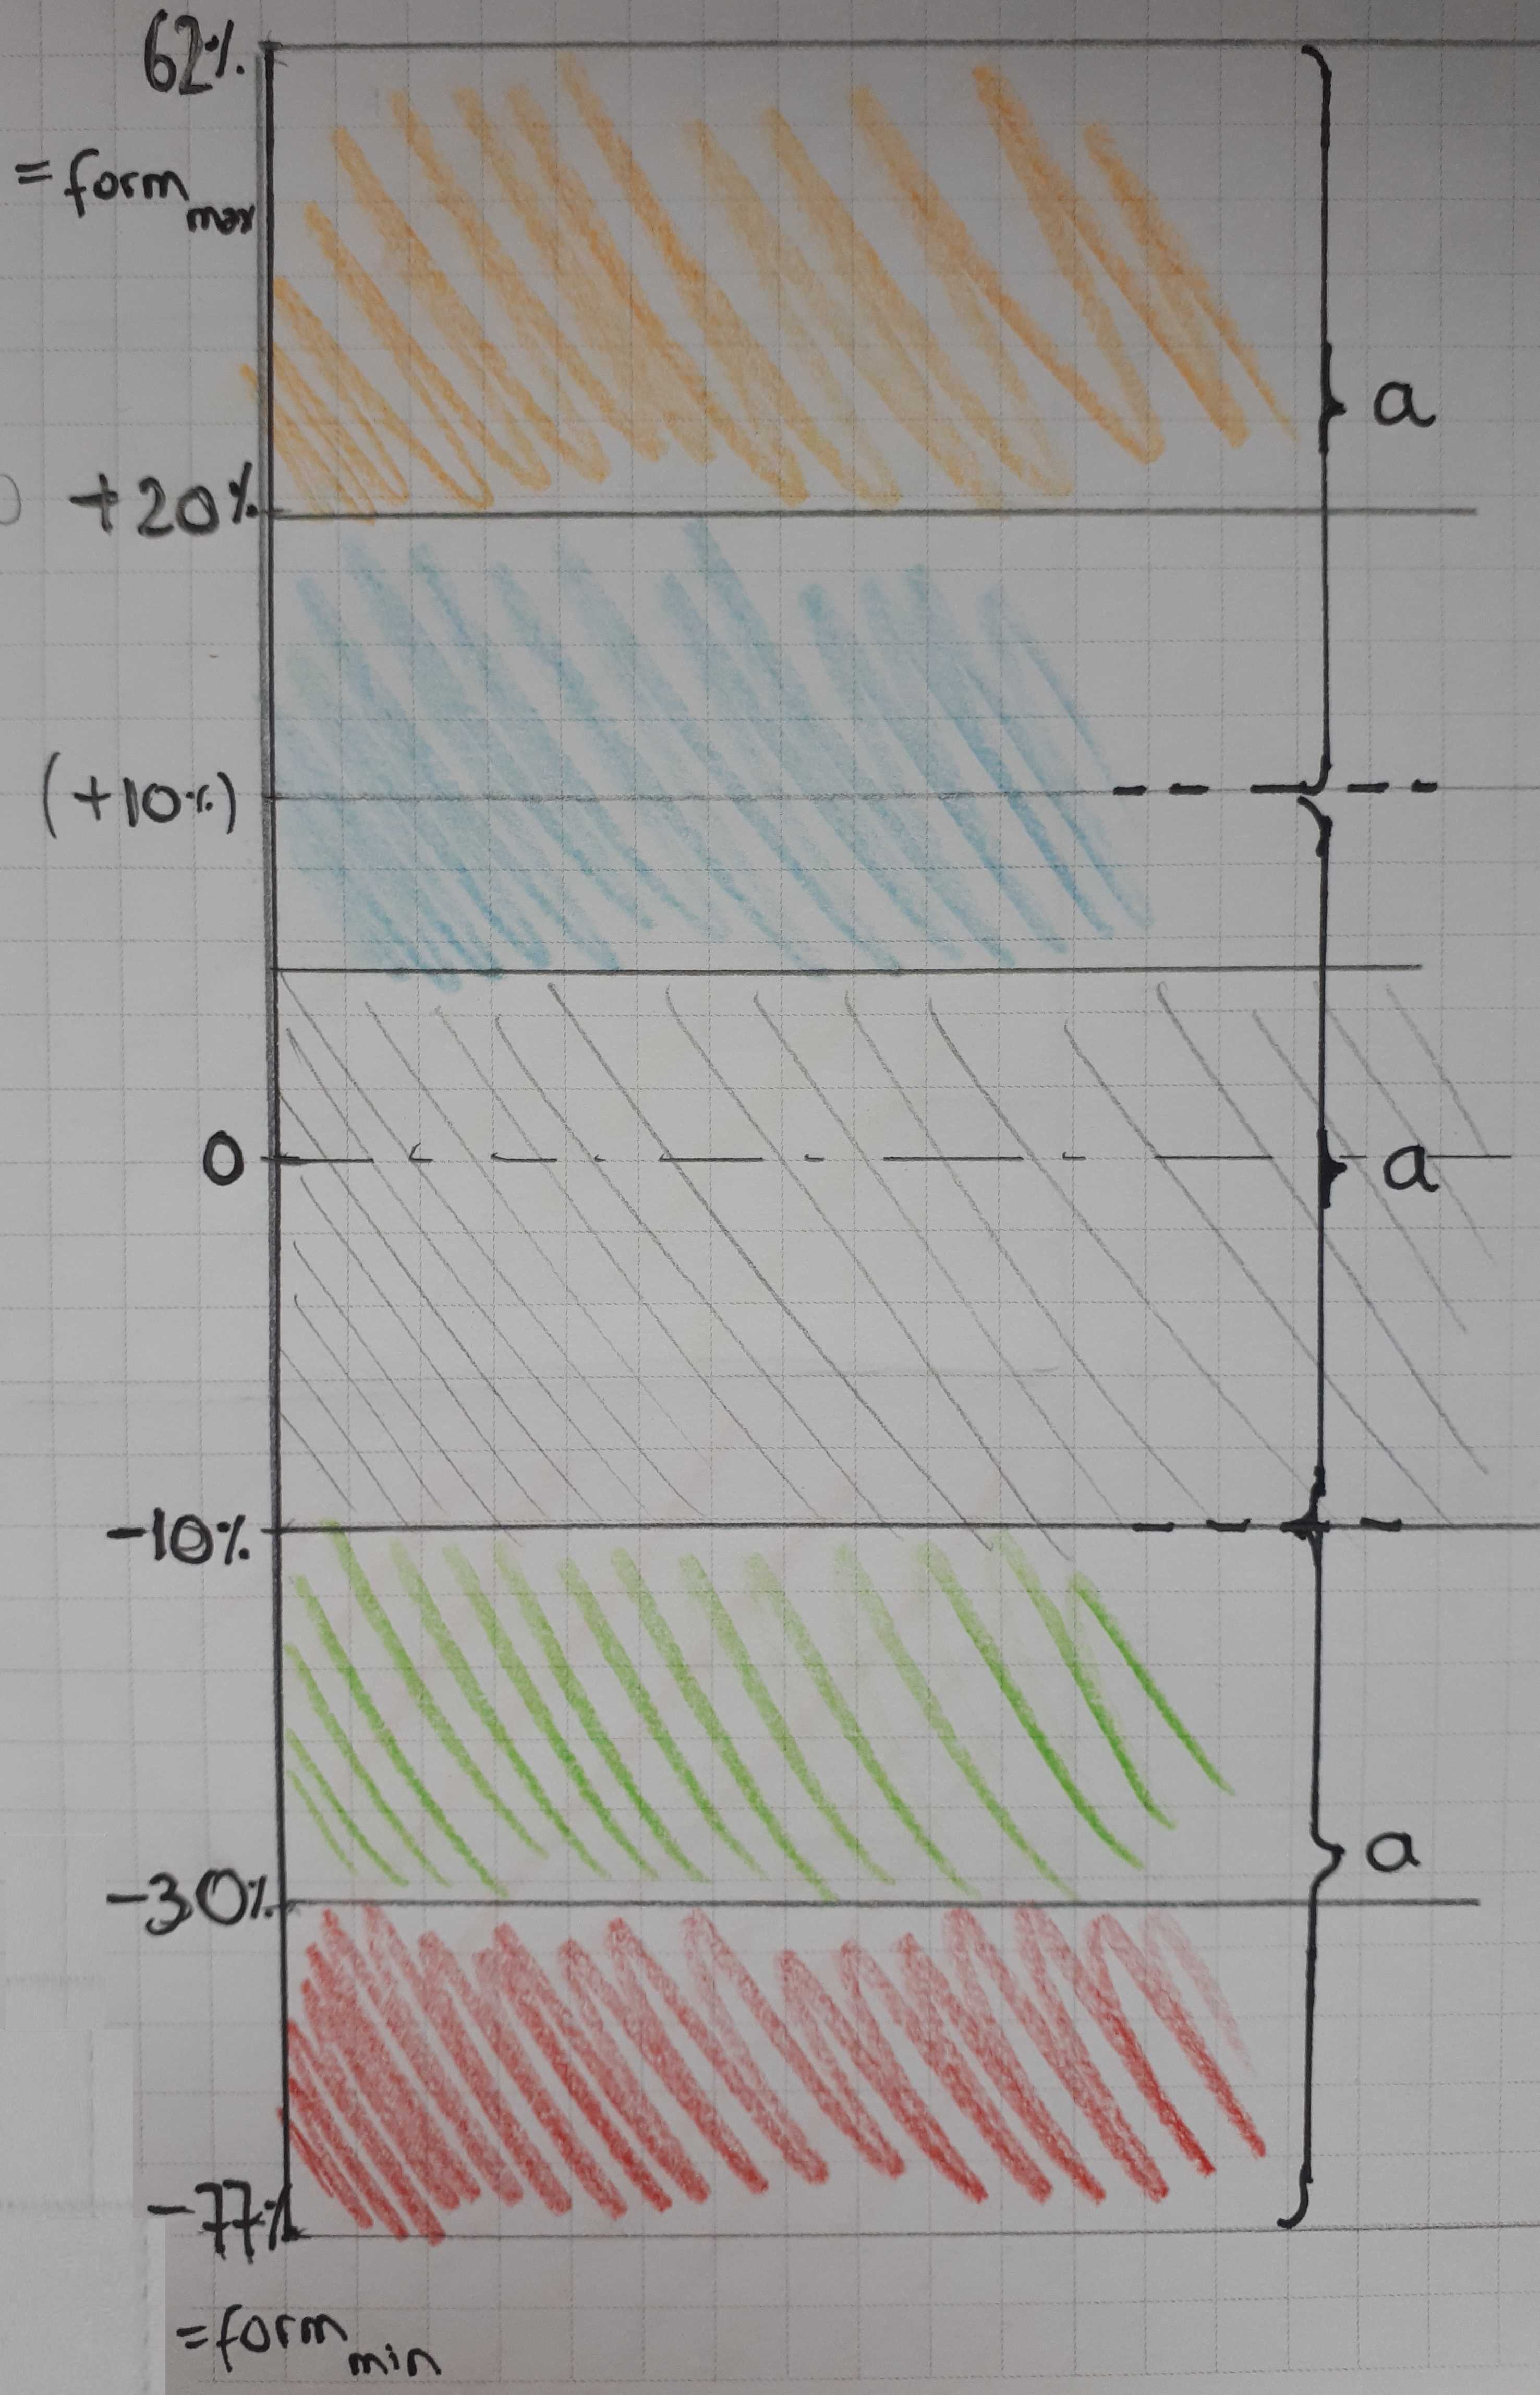
I’ve just done some testing and I think a relatively feasible and more even split of zones can be achieved as follows:
- split the chart vertically in three equally wide bands (width=a).
- determine min and max form%
- assign values as follows: the middle band takes values from [-10%;+10%] linearly; the bottom band [form_min;-10%] logarithmically and the top band from [+10%;form_max] also logarithmically.
This way, the majority of the space will be devoted to form between -30 and +30%, where the greatest resolution is required. Periods of extreme rest/overtraining will be rendered with less resolution.
Here is what the zones look for me with this scaling applied:
Will love to see if this will yield nicer charts when implemented.
3 Likes
I just swapped to this method after posting a question about TSB over on the TrainerRoad forum, it actually got some very good contributions and one of them was this way of looking at fatigue.
I recently did the first 10 stages of the RGT Giro series and tbh it was heavy going for me, many 75 to 105 minute rides with an AP well and truly in sweetspot, I did feel tired. However, on absolute values I was consistently in green bar one day in red but on percentage method almost all of it I was red, this did reflect how I felt. Aged 53 with a CTL of 64 yesterday.
5 Likes
The percentage shows how I feel better too. With percentage, I am more in the red, and that seems more accurate to me. 56 yr old with a CTL of 51, just finishing the second SSB block of Trainer Road.
2 Likes
I am super confused about all this… using the % based setting at my current fitness level it would take me 2 months to gain 10 fitness points without redlining. To me this just seems off because in the past i’ve seen greater fitness gains in a shorter time span (with a slightly higher fitness 40 - 50).
What is the recommendation for my current fitness level?
Wow I have just tried and my form is now a lot in red zone when before I was struggling to get into the green zone. I do only running (only very strong workouts go over 60 load) and my fitness is only 26. I was feeling like it was imposible to mantain green zone. I will read to try to understand. Thanks