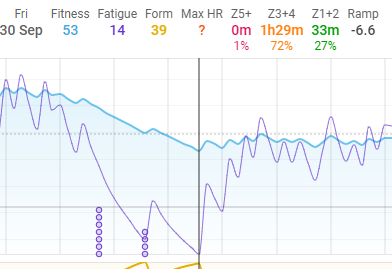
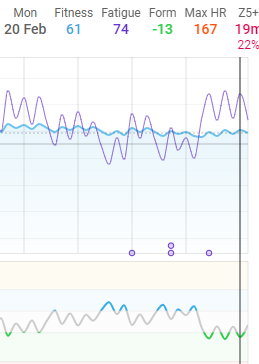
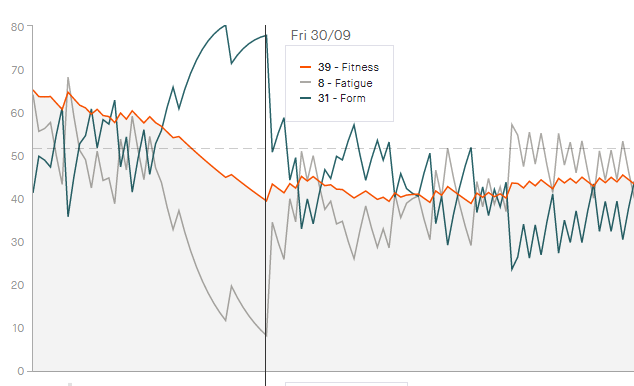
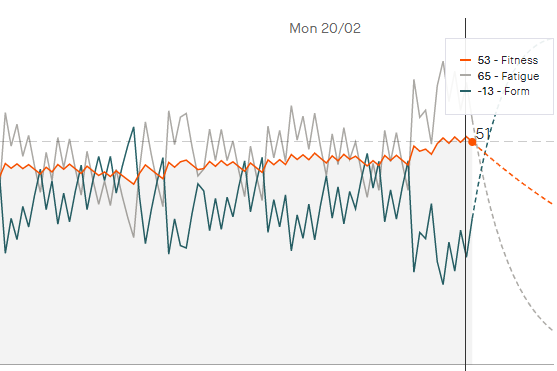
I checked the differences value of fitness on 09/30/2022 and 02/20/2023
Strava: 53-39=14, Interval.icu: 61-53=8 (subtraction result)


I checked the differences value of fitness on 09/30/2022 and 02/20/2023
Strava: 53-39=14, Interval.icu: 61-53=8 (subtraction result)


Here is my Strava and Interval fitness line where the vertical scale shows the same.
The values are different but the “profile” is similar.
Pick one and stick with it, rather than trying to compare between apps; they calculate the load slightly differently.
My profile on WKO5 is out by the difference in the way CTL/Fitness is calculated (yesterday vs today).
I overlaid both graphs and adjusted the scale. Both charts look similar but the grand total is different
What does it matter if they match? Pick one. Use it for your gauge. In the end, these numbers are general indicators. Very few people can tell a -35 from a -40 TSB anyway.
The official help for intervals says:
So, I would like to use it and see my progress. And if I’m training and I don’t see changes in the chart, so I started comparing with other apps.
It’s not about whether they match or not.
The question was whether intervals counts correctly. Maybe there’s a bug that needs to be fixed.
The grand total will be different because the way the lid is calculated. Strava is a social platform, so I ignore the analytics it gives.
The trend is the same, but because the load calculation is different it won’t have the same absolute value.
Xertonline also does things slightly different too, in the XSS. That’s because not all load/TSS is created equally.
Intervals is closer to other well known applications, eg. WKO5.
My PMC only differs by one day, due to the way Fitness vs CTL, Fatigue vs ATL and Form vs TSB is calculated.
One uses yesterday’s values and the other uses today’s values.
Trends are important, eg. if fitness is trending upward, it means your progressive training load is increasing. So use Intervals, as it truly does add value.
When I started Intervals.icu the fitness chart just about exactly matched Strava. Since then I think they have changed how they calculate training load. Also your FTP needs to be historically the same for every ride or the training loads will be different.
Ok I see. Nevertheless, I believe that regardless of the method of calculation, the assessment of fitness should be the same. I feel in my legs that my form is increasing, but it is not reflected in the Intervals fitness chart
CTL (which drives the “fitness” line) does not equate 1:1 with actual fitness…the fact your “feel” fitter in your legs is the key
The line trending up is an indication that the load (volume and intensity) is increasing. In some cases you will even feel fatigued after a period of time.
I see have read part of the Help section on this. Did you also read this one?
It explains why feel and numbers can mismatch.
What I noticed recently is that historical values of fatigue and fitness are changing over time. This is strange, I’m almost sure it was working differently in the beginning of 2023.
So for example if I finished a training block on 10th Feb with fitness 95 and form 120 it should preserve these values for this particular day. Right now this gets re estimated every day (and is actually being smoother and smoother). After 2 days 10th Feb shows lower numbers. It is very well visible on the color coded form chart.
These graphs are only indicating the progression in external training load. No matter how hard you are training if you do the same hard training week after week the graphs will be a flat line. To grow the CTL line you need to be progressively increasing you load every week. This however is the road to over training and poor performance. You should be more concerned with what is the effect of the training (and more importantly recovery) on actual performance. Eg is your FTP /CP increasing or time trial of race performance improving. There is only so long you can maintain a ramp rate without having to reduce load through taper or time off. It is these windows that performance will show itself. Ie on a downward sloping CHRONIC Load line.
If you have old activities loading in and being analysed the chart will change. It uses an exponentially weighted moving average so even very old stuff has some small impact. Once your history is complete and your historical FTP is all set then it should stop changing.
@david I’m pretty sure that all my workouts that can affect this are loaded and processed. I did full strava import in January. I also remember, that it wasn’t behaving like that earlier, I noticed this around 4 weeks ago.
Strava uses their own algo/formula to calculate fitness compared to TrainingPeaks (the standard). Strava over estimates fitness at higher levels and underestimates it at lower levels (like detraining).
Try deleting Strava as the data source and only use Garmin/Wahoo. The fatigue/fitness/etc is way off
This won’t make a difference…it doesn’t matter the source of the file…intervals.icu calculates the load value from the file imported into intervals, which is generated from the power, hr or otherwise data fields.