Tx. I wanted to do that but there isn’t space for the longer label on the “normal” height chart.
It works great!
Autoscaling sometimes makes me confused on constant power workouts
but still the colours let me understand if it was strong or superstrong.
Thanks again for implementation!
Best regards!
BN
Andrii_Magalich, david: Actually, the name of the scale is correct: it is “30s power”. Rather, it is that the scale is logarithmic.
There is a difference between plotting log 30s power and plotting 30s power on a log scale, and David has done the latter. So, if anything is changed, it’s the description below, not the name of the scale.
[Just to be really technical about it!]
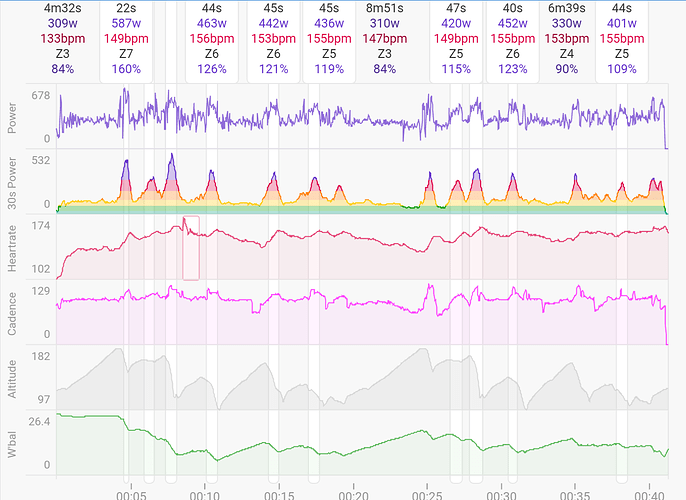
Very nice. It seems to offer more insight for the real workload of stochastic efforts versus structured/consistent intervals. Just looking at the raw power trace from a race or group ride doesn’t capture this well, especially if it’s surgey
@david - thanks for the new chart, I really like the display, which as mentioned above, tracks to hard efforts well (it also dovetails nicely with MPA from Xert).
You mention above that the colours correspond to power zones - I wondered if it is possible to show the power zones elsewhere using the same colours (for example, settings, activity power)? At present, my power zones elsewhere show up in purple only, and having the colours match across pages would be a useful way of eyeballing values etc.
I agonised over this. It’s better from a data visualisation angle but not sure for the design. Anyway your post tipped the balance. Its done now!
Thanks @david - that works very well I think
Donation incoming (donations and feature requests working in reverse this time round!)
Maybe if the graph had a log scale… it would look better when the activity has sprints? It’s the only bad thing about it.
Old post I know. On my page the chart it selected but it doesn’t show up
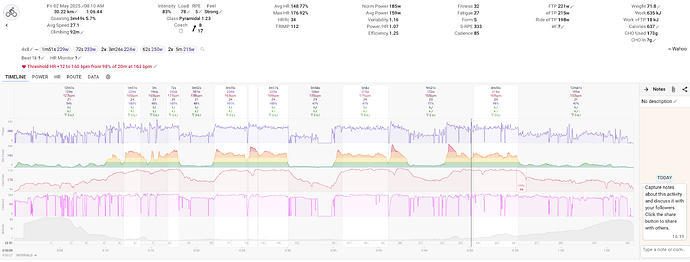
It could help, if you show a screenshot of this activity.
Do you have power for this activity? Is an FTP value set for this activity?
Now I am confused, because I see the 30s power chart, and that is what the thread was about?!
sorry…now I see it too…I mistakenly picked in something in the middle of this thread.
It’s that w/bal, the “matches” thing I don’t see…
You have to input a W’ in the settings ![]()
right…I’ll have to look up this in this forum about W’, meaning, definition, because I don’t know what value I should add there.
Easiest way to get in the ‘ballpark’ is to set a value around 10-12kj and then check some rides where you went to (almost) failure after several repeated efforts.
If the chart of W’ goes below zero, your value is set too low. If you know you went to failure and the chart still has several KJ left, it is set too high.
But understand that you need to have your FTP set quit accurately. FTP and W’ go together because W’ is the Power-reserve you have above FTP!
And don’t try to get it to an ‘exact’ value, W’ can be wildly different if checked on one single effort to failure or several repeated efforts where you fail on the last one.
That’s because the average recovery metrics don’t apply equally to everyone.
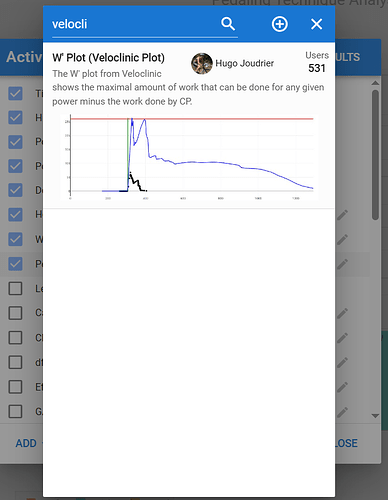
There’s also the Veloclinic plot (search the forum for more info) that was implemented as an Activity chart:
ok! I’ll start from there - thank you all!
If you’ve done a maximal effort, eg. 3-min, look at your average power for the duration. Assume it was 300W for 3m.
A =
3m = 180s
300W * 180s =54,000 joules
B =
Assume FTP is 220W * 180s = 36,900 joules
C = A - B
= 54,000 - 36,900 = 17,100 joules.
W’ is usually in kilojoules, so it would be 17,1 kJ in this example.
Edit: replied before finishing my train of thought.
Then check your other durations above threshold, eg. 30s, 1m, 2m and up to about 5-6m. It’s all (average power multiplied by total seconds) - (FTP multiplied by total seconds). Look for range of joules as the value you can enter in the settings. Reanalyse your rides, then, as @MedTechCD mentions, look on the chart to see if it (W’) drops close to, or just below zero.
fantastic!


