I’m trying to create a left/right balance metric as a custom stream from the fit file.
What values do I need to output in the data array to have a “50/50” metric ?
The following code is not showing data in the graph:
{
    let streams = icu.streams;
    let act = icu.activity;

    let gpr_l = streams.get('GPRL').data;
    let gpr_r = streams.get('GPRR').data;

    for (let i = 0; i < gpr_l.length; i++) {
        let sum = gpr_l[i] + gpr_r[i];
        data[i] = (gpr_l[i] / sum) * 100
    }
}
There is custom plotting code to handle the built in left_right_balance stream. That stream is stored as “% of right leg” so 65 means 35% from left leg, 65% from right leg displayed as “35/65”. Currently you can’t flag a custom stream as L/R balance to get that display and plot.
It’s not the same L/R balance as the one which is already available.
I’m investigating my L/R imbalance, and for that I created some custom streams (Gross Power Released, Gross Power Absorbed, Net Power Released).
But the L/R balance for GPR and GPA would also be useful to see.
Hi Davids, as I would also like to investigate my “net power released” and gross powers released and absorbed, and the balances of these – I though I use the custom activity streams of @David_Scheers
I found some but not all streams I would like to use – do, e.g., the “power absorbed” streams exist and are public, @David_Scheers ?
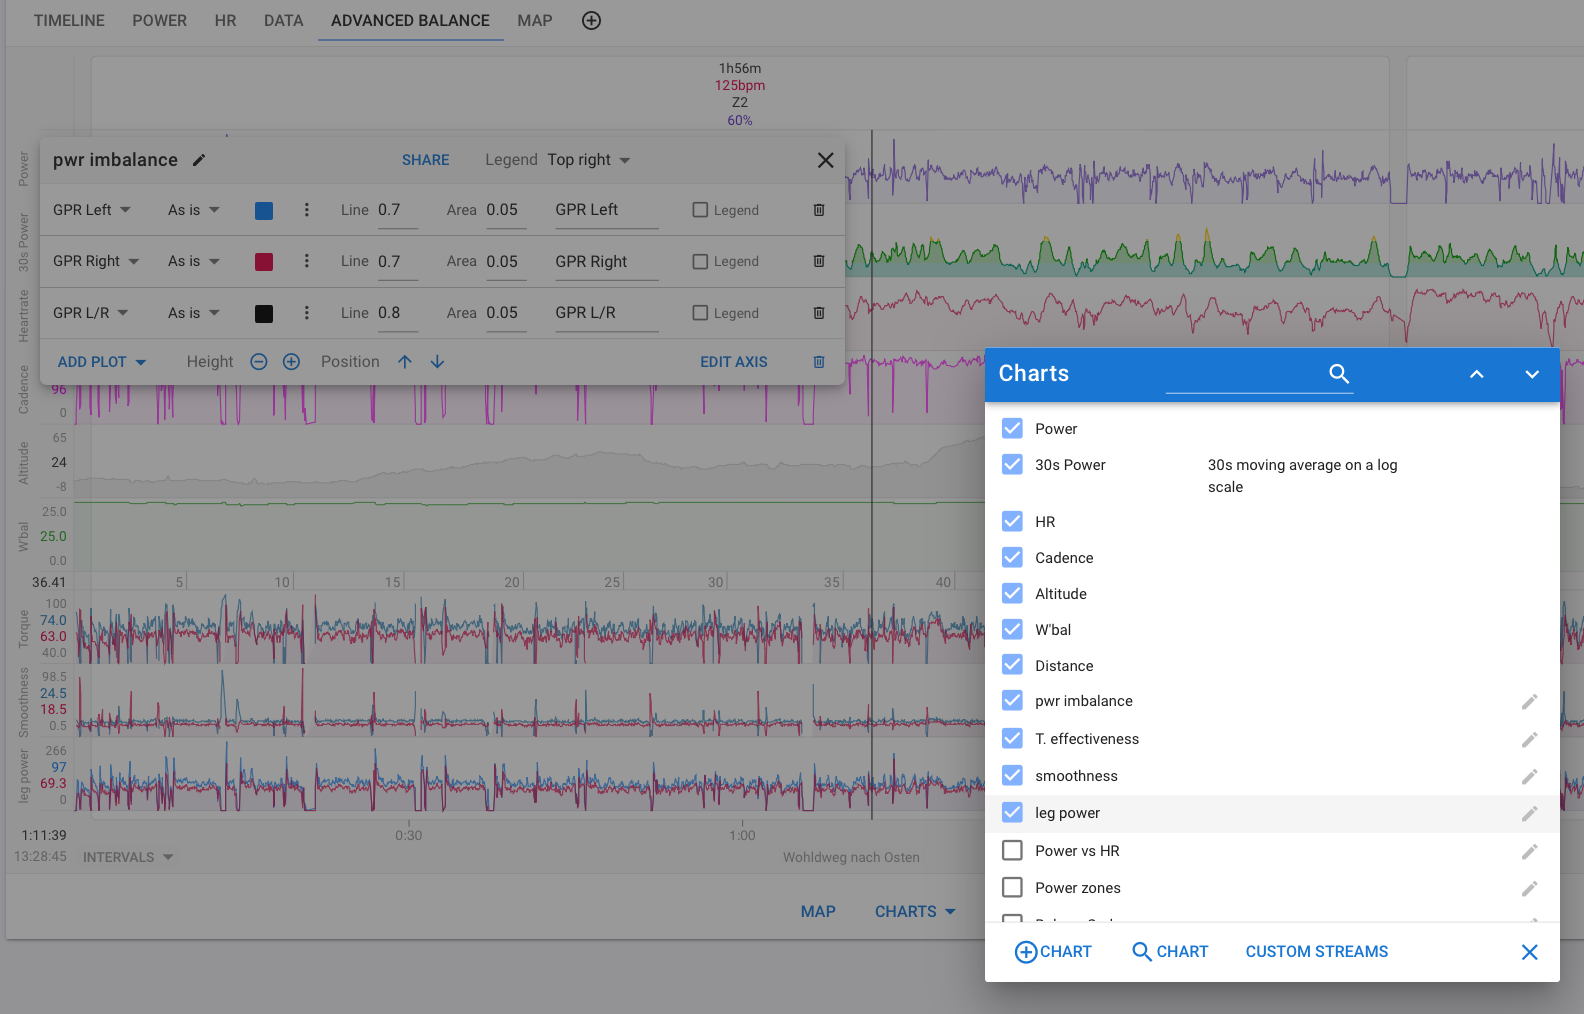
However, more importantly, I could select and add the customs streams to my analysis – nut using them in my activity pages does not seem to work:-o
Standard (timeline charts) do not sho at all, a heat map I created (GPR L?R vs. power) does not render, or, does not render anything but the heading/title.
Do this streams work and should I be able to use them?
Is there anything special I need to do?
I am looking at activities recored using Assioma Duos.
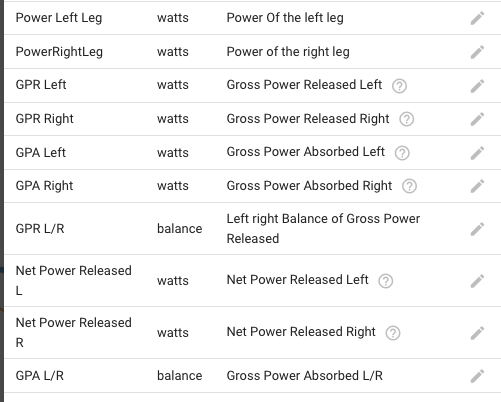
These are all the custom streams I created. They should all be public.
Then I use these streams in custom graphs, where I apply a moving average to the stream, to smooth out the fluctuations.
Creating a timeline chart with the left/right leg power works. If I create a chart – or more accurately add the plot to a chart – with, e.g., the GPR streams the chart disappears from my timeline. It is still listed in the charts, but the graphics box disappears. This is for activities which do display TE and PS… :-o
There is a lot going on here. Could you please add a new tab to the activity detail view with just the minimum number of charts etc. to demonstrate this problem. Tx.
The problem is that many of those custom activity streams depend on other custom activity streams. Intervals.icu computes the ones with “Process fit file messages” first, then the others. The order is defined by an index associated with the stream and its id (basically creation order). Currently that index isn’t exposed anywhere. I need to make the custom streams dialog support moving streams up/down to set the computation order.
You need to look at the scripts and order them so scripts that depend on other custom streams are further down the list. Also make sure the “Processes fit file messages” box is unticked for streams that do not do that. That still overrides the order. I already did that for all of yours and put them in the correct order.
Then you need to do Actions → Reprocess file to recompute all of them.
Hi @David , makes sense and works now. Thank you very much!
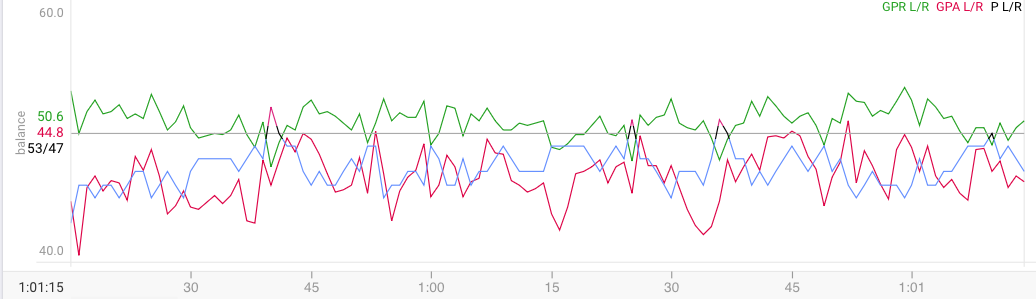
However, I do have a funny problem with these data – or in fact, with standard data, i.e., “balance”, related to this. I created a chart with GPR L/R, GPA L/R, and balance (L/R). The latter does only partly obey it’s color scheme:
Hmm, this is great for the standard balance chart, but unfortunate for such custom charts – even more so, that legend and numerical value displays don‘t reflect it but are the user-set color (black here).
Could one get this „off“?
Maybe I should create a custom stream for the normal L/R, too, and use that;-)
Kinda late reply, but how do you find out what fields you need to dig into this? I’m talking about the 104 and f_2. I’ve been looking at some activities in online fit file viewers plus the SDK but haven’t found this info anywhere.
I can see that… Either you jump into cold water or we create a second stream;-)
If you don‘t like this cold water, maybe you could provide a „balance_simple“ or similar?
Otherwise, I assume I could create a custom stream copying the data, which would be „simple“ (single color as chart-defined)… not?
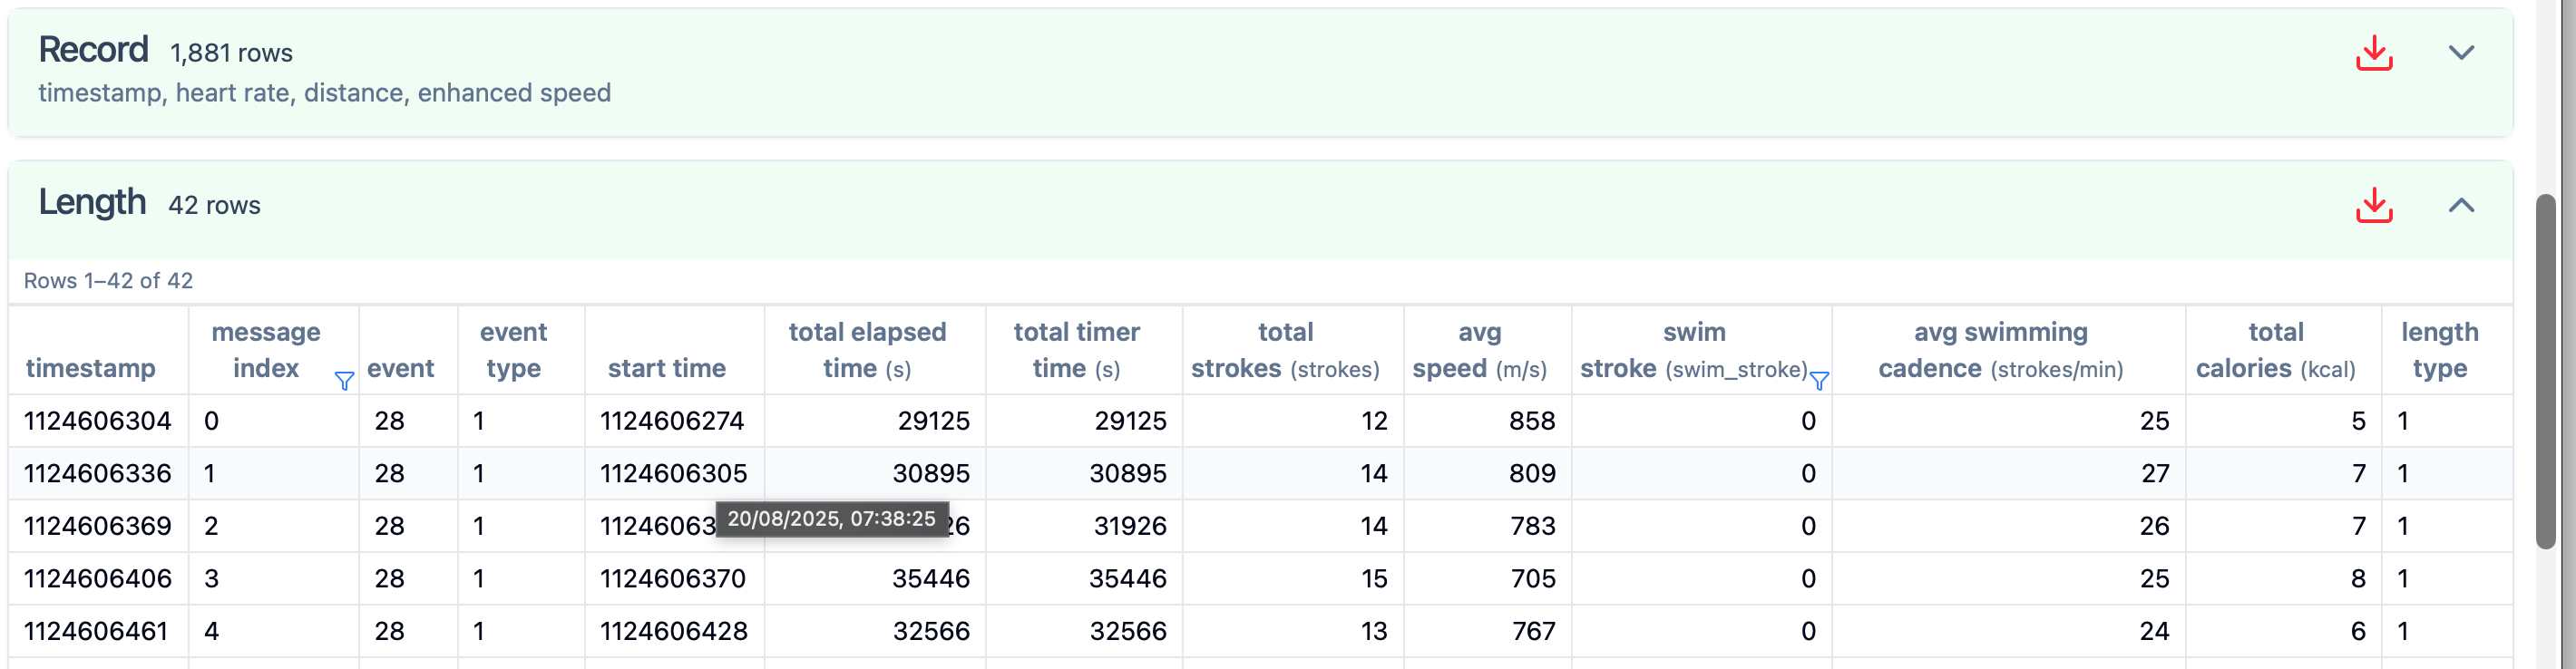
Hello, I am trying to create some custom streams from a pool swim activity recoded using the Apple Watch.
using fit file viewer I can see that a lot of the data is stored within Length (as in length of pool).