I recently rediscovered CIL and was thinking about its various applications. The article below shows it in the context of a cyclist moving from “base” phase training to specializing for their main event. I had the idea that it could be used for time-crunched cyclists on high-intensity plans to manage stress or for polarized athletes to help with tracking periodization/progressive load in intensity workouts. The formula is very simple and there are many user-created charts on WKO4.
that is very relevant to a time crunched plan. Thanks for sharing.
So, if you do not have WKO4 (or a paid TP account?), is this something that would be easy-ish to implement? I guess you could take a spreadsheet and feed it with the numbers you do have and apply the formula to it, but could it be added here?
I guess it would just be another line of the chart on the “Fitness” tab
Yes, but I have no idea if that is hard to implement…
Its not hard to implement, however there may be other ways of identifying intensity in training to consider e.g. showing “time in zones” on the /fitness chart (stacked bars for each week?). Another option would be to change the way training load is calculated to favour intensity more, then CTL and ATL would better reflect the intensity of the sessions which is what this is doing. Lots of things to think about.
Presentation of the data is the issue here, not calculation.
First, I don’t think that modifying CTL/ATL is the way to go. These are established metrics for total training effort, though they do suffer from the problem of relying on the imperfect metric that is TSS [which assumes that an interval of 350 watts after 10 minutes riding is the same as an interval of 350 watts after 3 hours of riding].
Second, stacked bar charts are seriously difficult to read. I could have my fitness chart showing long periods, such as one or two years, meaning that there are 52 or 104 such bar charts to compare. The alternative to stacked bar charts is grouped bar charts. like you have for the weekly time in zones. But 52 or 104 of them would be information overload!
But the advantage of this line of presentation is that the charts would be separate from the current CTL/ATL graph. At the moment, that is an elegant representation of the data, not to be carelessly thrown away. So I conclude that the most appropriate option for such data would be a separate chart of CIL/AIL that parallels the current CTL/ATL chart. This could be either an option offered at the top of the existing page or automatically populating the existing page.
I think I will add support for user-defined functions. Then I can do this easily and people will be able to come up with interesting things. First need to sort out training load for non-cycling activities with HR.
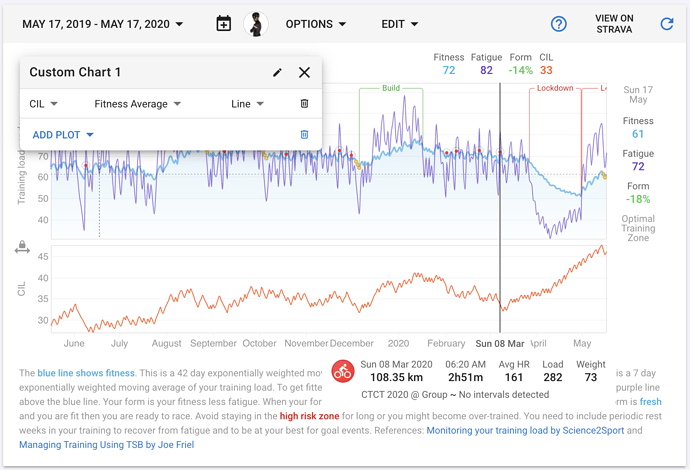
You can now add chronic intensity load using the new custom charts feature. I am going to add an easy option to plot it on the main fitness chart soon. Its an interesting trace. During lockdown I could only ride on the trainer (which I loath) so I just did 1h sessions with more intensity. Now I can ride outdoors but only from 6am to 9am (sun up at 7h20 or so and its Winter) so I am doing 2h rides with higher intensity than old 3h weekend rides and it shows nicely on the chart.
One thing I still need to do is derive intensity for activities without power but with duration and training load.
Sorted. Activities with duration and load now get intensity so the CIL calc will work properly.
Did you add an option to add CIL to the main fitness chart, or is it still the added custom chart?
It is one of the built in plots:
You can also choose “Intensity” and “Fitness Average” and get the same thing.
Tnx, yeah, found that. I understood that it might be possible to overlay it on the main Fitness chart. Cheers.

