OK Thank you
1 Like
The best/economical option would be to get a Polar H10 strap, which can be used with the Polar Flow app and HRV4Training to measure HRV. The camera app is okay, but unless you lay absolutely still, you can get artefacts.
Sleep duration and perceived quality (how you felt after waking up) can be tracked in HRV4Training. The data that so-called smart watches give about deep sleep, light sleep, etc., is just a guess based on breathing. Brainwaves need to be measured to determine the different stages of sleep. How much sleep you got and how you felt is enough.
You can do the Polar “Fitness test”, that estimates your VO2max from a 5-min test at rest. It gives a different number, for me, compared to Garmin, but is at least consistent when comparing the trend of both.
As you mention HRV in particular, measuring it effectively, and according to a well known protocol, will give the best result… how have you recovered from the stress of yesterday, which is why it’s done first thing in the morning.
My 2c worth.
1 Like
Hi Gerald,
You are always kind!
Now I am trying to create a custom graph with the heart data in the Fitness section, connecting HRV4Training via dropbox since the only alternative is to import this heart data in intervals.
Not easy and convenient at all
Gerald,
can you tell me if it is possible to create a custom graph, where I can manually enter the data each time? Or are we forced to acquire the data via CSV?
…after going crazy with the body composition csv some time ago, remember, I decided to make the graph and insert them manually once a week
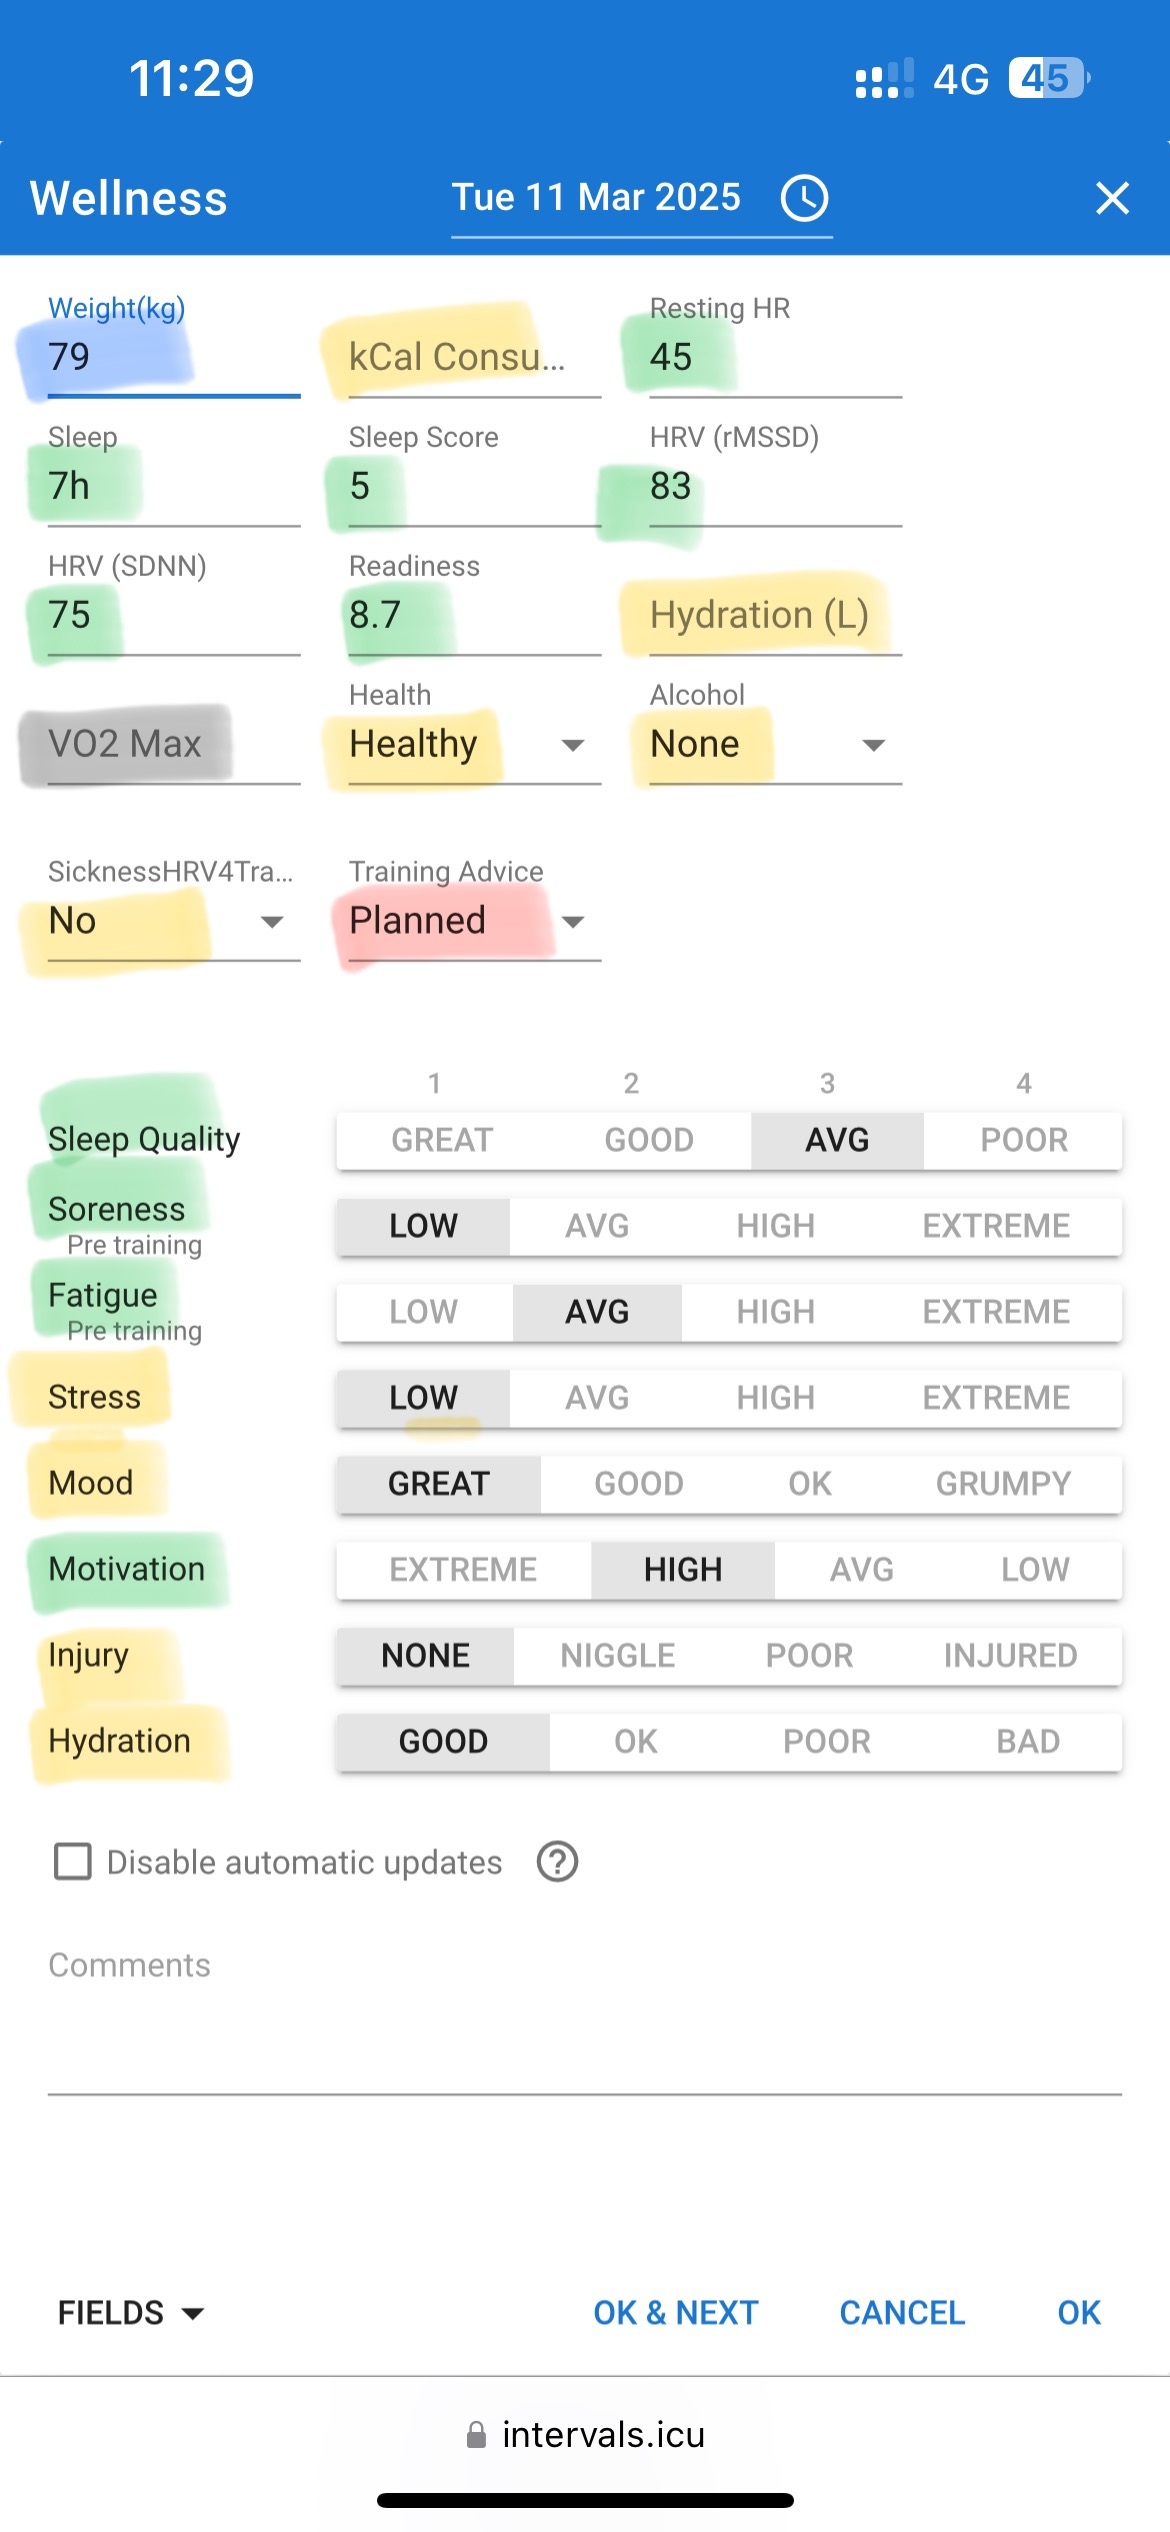
The data from the CSV is populated in the wellness fields. In my setup, I have the following:
- Green = CSV file update
- Yellow = manual update
- Blue = auto fills if I don’t add anything. Occasionally have to manually update.
- Red = updated from the MatLab script, after reading the green data.
- Grey = auto updates from the Garmin fit file (if an activity is recorded).
1 Like
Thanks Gerald,
I’m starting to understand.
So, if I create the custom data that interests me in the Wellness tab that I will fill in manually each time, and I also add the ones that synchronize automatically from the recording apps, everything works.
Then I can go and compose some graphs in the Fitness section, right?
Yes, that would be correct.
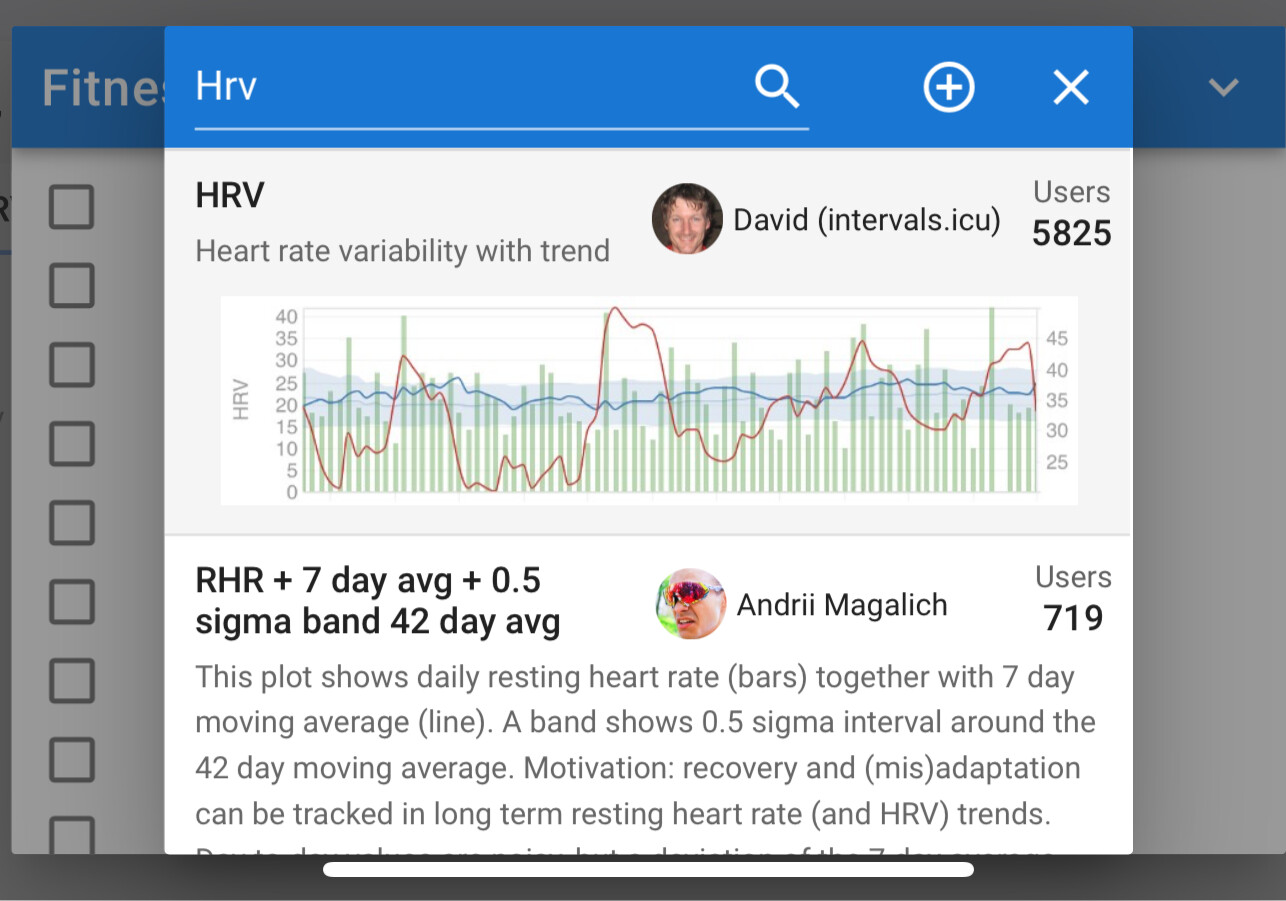
There are existing charts created for some of the more common metrics, eg. HRV., so you don’t have to start from beginning.
I have seen the multiple types of graphs already made.
Now I have created in the wellness window, the data that interests me, I have filled them with the values, but it happens that it also shows them in the calendar. How can I exclude that they are displayed in the calendar, and displayed only on the graph?
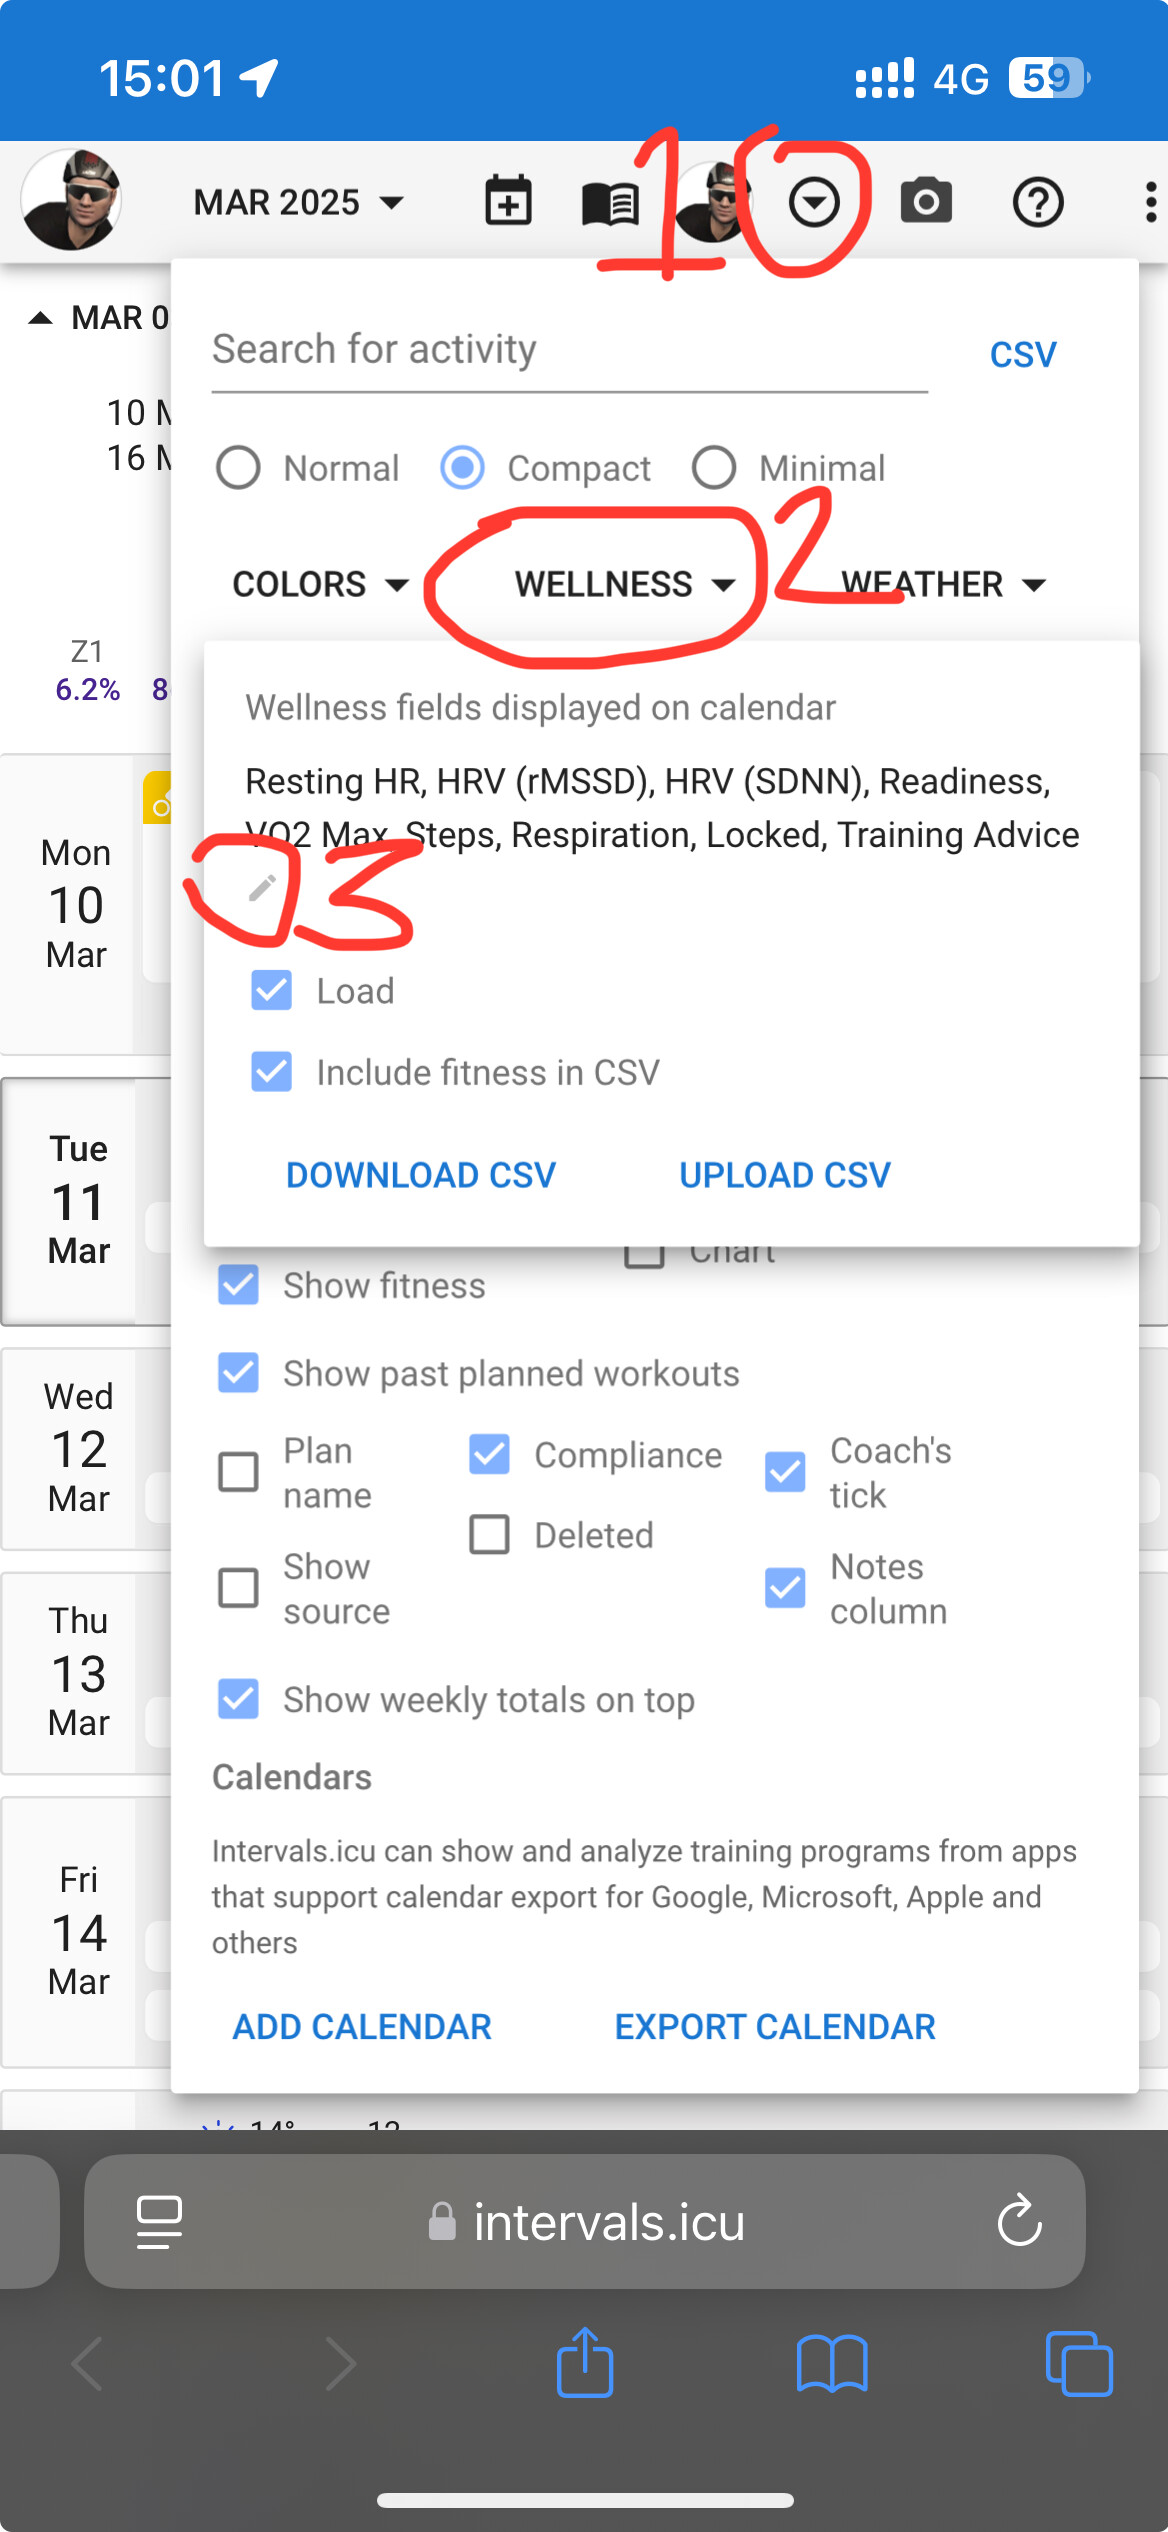
now I understand, you create the fields and they are visible on the graph, and if you flag them they are also visible on the calendar…
Thanks Gerald ![]()
That’s simply the Astrand formula. VO2max = 15.3 x (HRmax/HRrest).
All Polar flow is doing is measuring your HRrest from those 5 min and then apply the formula with the HRmax that it has.
1 Like
Based on the days I’ve done the test, my resting HR was low 40s. It would have to have been 48-53 to get to the values using the formula.
Luckily I don’t attach any value to it.
“I use Garmin because I had an early Garmin edge and stuck with it from there. I have to say I don’t love the company or the ecosystem or the way they work - I find the device’s expensive and unintuitive and have never had a good experience with customer support either.”
Agreed. So true ![]()
I currently have an Apple Watch Series 6 GPS+Cellular, but I’m really tired of having to charge it every night. It prevents me from tracking my sleep properly. I know it’s a great smartwatch, but I’m looking for a change.
I’ve never used the SIM (I always carry my smartphone with me), so perhaps NFC for making payments is more useful in my case.
My activity is 99% cycling, I use a Wahoo GPS, and I would only use the watch for my daily “wellness” and maybe record some specific activities, such as walking or running.
A watch that correctly collects reliable wellness data from intervals.icu, has NFC for making payments, and has some GPS for walking or running?
It’s important that the battery lasts at least 2-3 days; I’m tired of charging my Apple Watch every night.
I’m reading and looking for information, but I’m undecided.
Garmin Instinct 3 series have NFC for Garmin Pay
When i wear my Apple Watch during the day it runs too low to wear to bed. Since sitting around for a few hours before bed isn’t capturing much useful health data, I charge it between getting home from work and bed. Only needs a couple of hours to charge fully. Now it’s good for overnight and 6am hill repeats.
I decided against the cost of Garmin head unit. WAY too expensive since I don’t have a power meter. Though 80% of outdoor exercise is cycling, I wanted only one device for cycling and running. A low-budget though accurate chest strap HRM and Apple Watch GPS is fine. I do think I’m missing out on power reading, but since I don’t race the bike anymore I’m not convinced the cost is necessary to stay fit. If anyone knows why a head unit is worth the investment without power meter or rear blinker w approaching-car function, I’d love to hear it.
IMHO easier to do intervals with a bike computer, and of course the all important no-tan-lines ![]()
![]() which require removing watch before getting on the bike. No-tan-lines also requires doing the triathlete no-see-um socks which for many cyclists is
which require removing watch before getting on the bike. No-tan-lines also requires doing the triathlete no-see-um socks which for many cyclists is ![]() but hey you gotta look good off the bike too!
but hey you gotta look good off the bike too!
Funny. Because when I think of triathletes, I think of these kind of socks … lol
2 Likes
I like the watch tan line. Tan lines from socks are a drag. Point about intervals with a bike computer over a watch is well taken. I have old Timex running watches I use on the handle bar, but my eyes can’t read the screen anymore. still can’t justify the cost of a Garmin, though. Maybe I’ll go back to a simple Cateye with wicked big numbers.
1 Like
Intervals.icu now has support for Amazfit devices. No HRV yet though.
1 Like